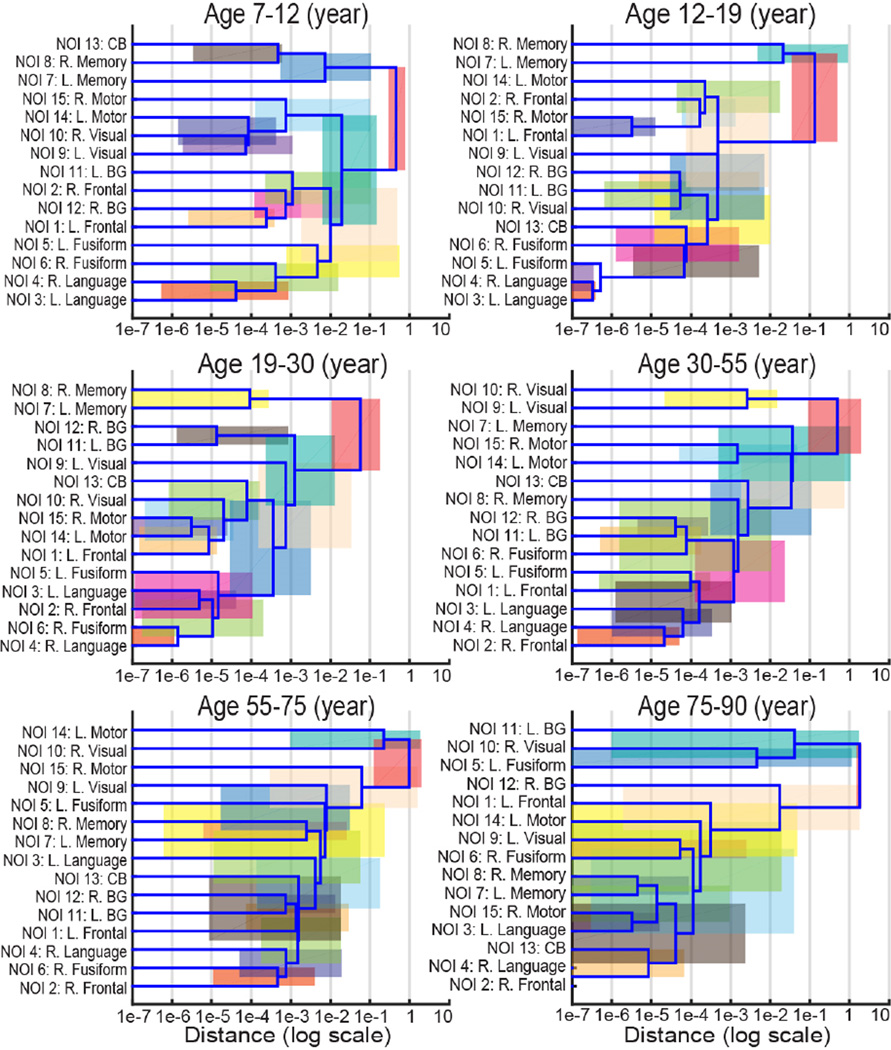
Fig. 4.
The six structural covariance networks (SCNs) dendrograms using hierarchical clustering analysis (HCA) indicate which NOIs develop together during different developmental periods (age bins). The distance on the x-axis is in log scale, which equals to one minus Pearson’s correlation between two curves. The correlation between NOIs becomes stronger from right to left on the x-axis. The horizontal range of each colored rectangles indicates the 95% CI of distance from 10,000 bootstrap samples. Note that the colors are chosen for visualization purposes without quantitative meanings.

