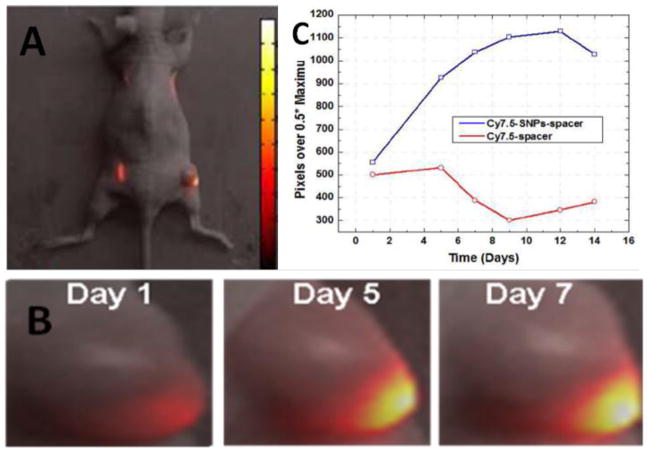
Figure 5.
A) Live animal in-vivo optical fluorescence imaging with the mice implanted with prototype SRB. B) Optical fluorescence (same intensity scale) of live mouse tumor over time. Day 1 represents image 1 day after implantation, and so on. C) quantification of the fluorescence intensity highlighting the ability to customize the release kinetics of the payload (reference xxx).

