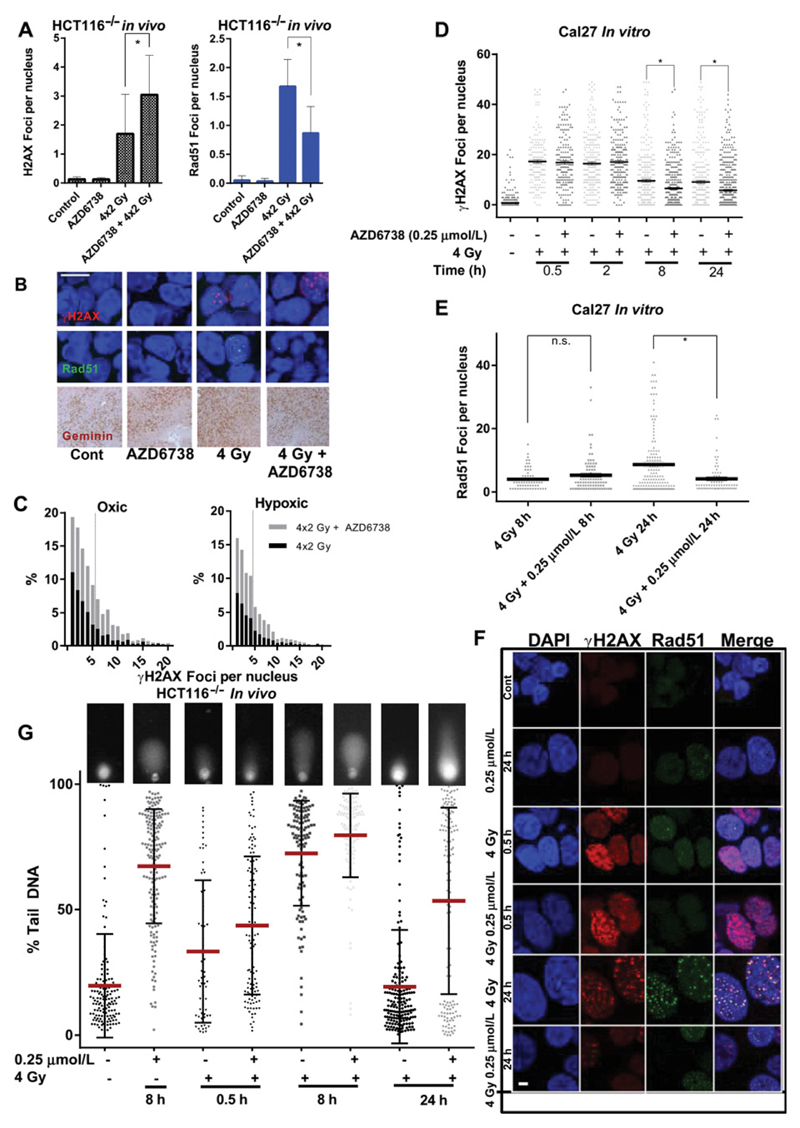
Figure 4.
A, Quantification of γH2AX (A) and Rad51 (B) foci in formalin-fixed, paraffin-embedded HCT116 (p53 null) xenograft tumors at the indicated time points after a fractionated course of 2 × 4 Gy (daily fractions) given with vehicle or 75 mg/kg AZD6738 daily by oral gavage, 2 hours prior to irradiation. B, Representative images showing cells quantified in A and B. Scale bar, 10 µm; bottom row, immunohistochemical staining with anti-geminin antibody of xenografts shown in A. C, Histograms of γH2AX foci distribution in oxic and hypoxic conditions (determined by pimonidazole staining) for radiation alone (4 × 2 Gy) and radiation + AZD6738, for formalin-fixed paraffin-embedded specimens from the in vivo fractionated regimen used in A and B. D, Quantification of γH2AX foci at the indicated time points after a single fraction of 4 Gy in the presence or absence of 0.25 µmol/L AZD6738 in Cal27 cells. A minimum of 3 high-power fields were analyzed from each of 2 independent experiments, an average of 356 (range, 174–653) cells per condition were analyzed. E, Quantification of Rad51 foci per nucleus at 8 and 24 hours after 4 Gy in the presence or absence of 0.25 µmol/L AZD6738. Only Rad51-positive cells were quantified (average 89.5 cells per condition, range 63–144). D, E, Data per cell presented, analyzed by one-way ANOVA with multiple comparisons. Error bars, SEM. At least 2 independent experiments. F, Representative images showing nuclear foci presented in D and E; scale bar, 1 µm. G, Alkaline comet assay analysis for the indicated conditions. Cal27 cells were treated with drug or DMSO 1 hour prior to irradiation and lysed at the indicated time points before alkaline comet assay was performed. Single-cell data for percent tail DNA are presented; inset images are representative comets for each condition; line represents mean; error bars, SD. Data from 2 independent experiments.

