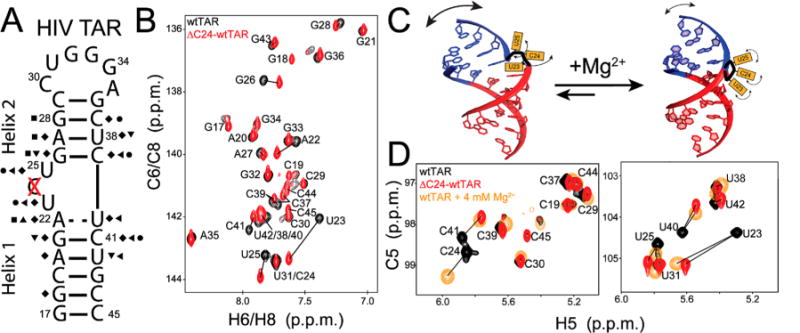
Figure 1.

Chemical shift comparison of wtTAR and ΔC24-wtTAR. (A) Secondary structure of HIV-1 TAR and ΔC24-wtTAR where the deleted bulge residue is highlighted with a red X. Symbols on the secondary structure indicate sites with significant chemical shift perturbations [ > 0.25 ppm (see Methods)]: C6 H6 (circles), C8 H8 (squares), C2 H2 (triangle), C5 H5 (left triangles), C1′ H1′ (diamonds), and N1 H1/N3 H3 (inverse triangles). (B) Aromatic two-dimensional (2D) HSQC overlaid spectra for wtTAR (black) and ΔC24-wtTAR (red), with lines highlighting resonances showing significant chemical shift perturbations. (C) Two-state TAR equilibrium. (D) Overlay of 2D HSQC spectra of wtTAR (black), ΔC24-wtTAR (red), and wtTAR in the presence of 4 mM Mg2+ (orange),91 with lines highlighting resonances with significant chemical shift perturbations relative to those of wtTAR under low-salt conditions.
