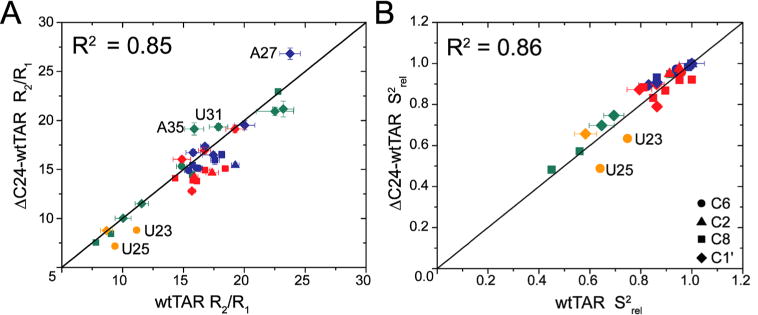
Figure 2.

Characterization of picosecond-to-nanoseconds motions using spin relaxation. Shown are comparisons of (A) 13C R2/R1 ratios and (B) the relative order parameter, Srel2, measured in wtTAR and ΔC24-wtTAR. Data are colored according to helix 1 (red), helix 2 (blue), bulge (orange), and apical loop residues (green). Symbols represent spin type, C6 (circles), C2 (triangles), C8 (squares), and C1′ (diamonds).
