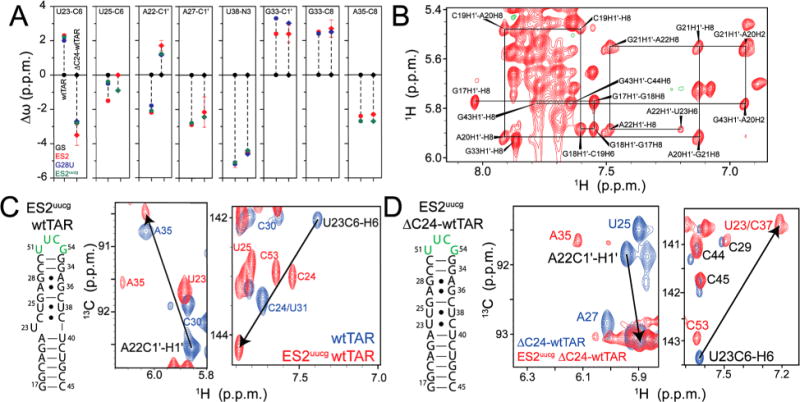
Figure 5.

Trapping ES2 in ΔC24-wtTAR using mutations. (A) Comparison of Δω between ES2 and the GS of wtTAR (circles) and ΔC24-wtTAR (diamonds) as determined by RD (red), and the G28U (blue) and ES2uucg (green) ES2 trapped mutants. Errors in RD chemical shifts were determined from the standard error from the global fit. (B) Nonexchangeable region of the 1H–1H NOESY spectrum for G28U-ΔC24-wtTAR, highlighting the sequential assignments from G17 to U23 (solid black lines). (C and D) Secondary structure of ES2uucg for (C) wtTAR and (D) ΔC24-wtTAR, highlighting the mutated apical loop residues in green, with 2D HSQC overlays of the wtTAR and ΔC24-wtTAR (blue) and their respective ES2uucg trap (red). Black arrows highlight the opposite sign of Δω between GS and ES2 for A22 C1′ and U23 C6 in wtTAR and ΔC24-wtTAR.
