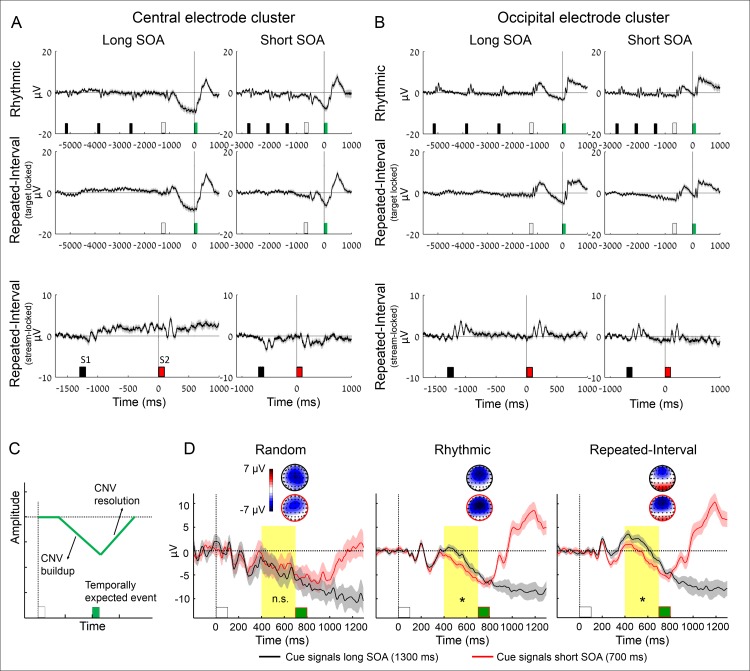
Fig 2. The CNV buildup is similarly modulated by rhythm- and memory-based temporal predictions.
(A, B) Group-averaged ERPs elicited by the stimulus sequence in the different conditions in central (A) and occipital (B) electrode clusters. Black/red bars: sequence stimuli (prior to the WS), white bars: WS, green bars: targets. Top row: Rhythmic condition, locked to the WS, in an interval extending from the third stimulus prior to the WS up to the target (all trials had at least three stimuli prior to the WS). Middle row: Repeated-Interval condition, locked to the WS (interval identical to the Rhythmic condition). Bottom row: response to the last pair preceding the WS-target pair in the Repeated-Interval condition, locked to the first stimulus of the pair (S1). These pairs are not presented in the middle row, as their timing was jittered relative to the WS-target pair. (C) Schematic illustration of the CNV stages. (D) Group averaged responses (average across a 9-electrode central cluster) locked to the WS (white bar) onset. Note more negative CNV waveforms when expecting a target at the short (red) compared to the long SOA (black) in the two predictive conditions. Error margins reflect the standard error for the difference between SOAs; scalp topographies are averaged across 650–700 ms post-WS, just before the short SOA target (green bar). Yellow background marks the predefined interval for analysis (*p < 0.05).

