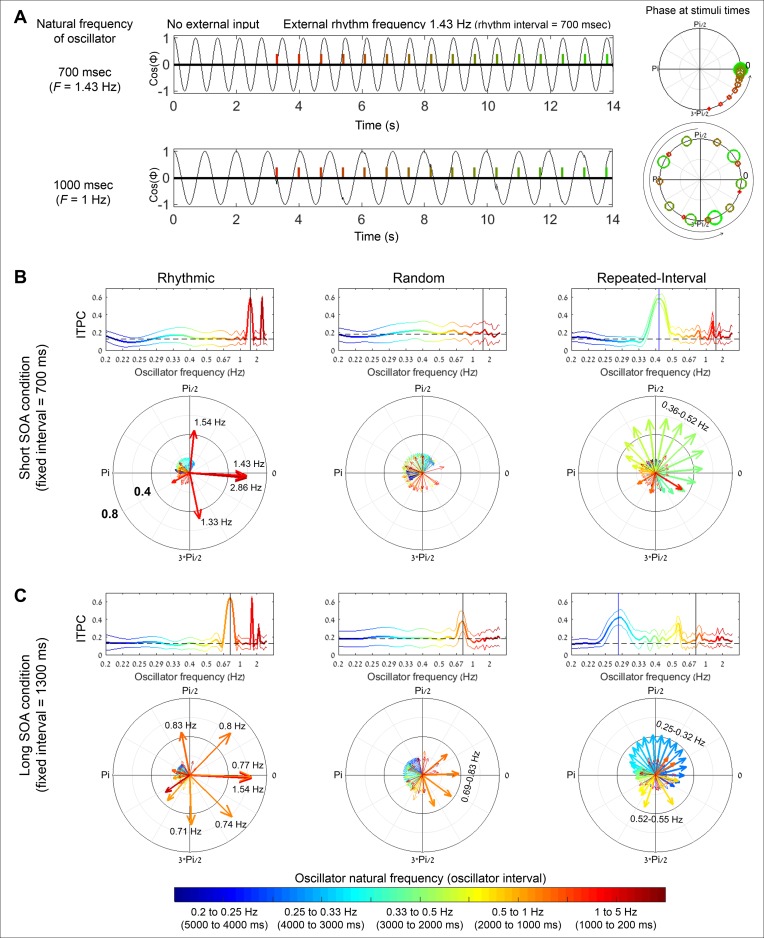
Fig 7. Predictions of an oscillatory entrainment model for the ITPC and angles in the experimental conditions.
(A) Angle dynamics of two modelled individual oscillators (top row: with natural frequency of 1.43 Hz, and bottom row: with natural frequency of 1 Hz) entrained by the same rhythmic stimulus stream with frequency of 1.43Hz. Left: cos(ϕ) values as a function of time, first without an external entraining stream, then when exposed to the external entraining stream. Right: ϕ values at rhythmic stimuli times, color coded from red to green and from small to large with the progression of the stream along time. The stimuli entrain (phase-align) the oscillator with the matching natural frequency but not the one with a diverging frequency. (B) Modelled phase pattern of an array of oscillators with frequencies ranging from 0.2 to 5 Hz with exposure to the stimuli streams of the Rhythmic, Random, and Repeated-Interval conditions (left, middle, and right columns, respectively) with short SOA (700 ms, equivalent to 1.43 Hz). Different colors indicate the natural frequency of the oscillators. Top row: modelled ITPC values at target times (thick line) with 95% CIs (thin lines, Bonferroni corrected for multiple comparisons for the number of frequencies). Dashed horizontal line indicates the ITPC expected by chance, based on a surrogate distribution of ITPC with matching trial numbers. Black vertical line indicates the oscillator whose frequency matches the stream frequency (here 1.43 Hz). In the Repeated-Interval condition, a blue vertical line indicates the oscillator whose frequency matches the slow rhythm that is generated by every second stimulus (0.42 Hz). Bottom row: mean angles at target times across trials predicted by the model for oscillators with different natural frequencies. The length of the arrows represents the ITPC. The color of the arrows represents the natural frequency, corresponding to the colors in the top row. Frequencies with relatively high ITPC are annotated with numbers. (C) Same as B for the long SOA (1,300 ms, equivalent to 0.77 Hz). In the top row, black and blue vertical lines indicate oscillators with frequencies of 0.77 and 0.28 Hz, respectively.

