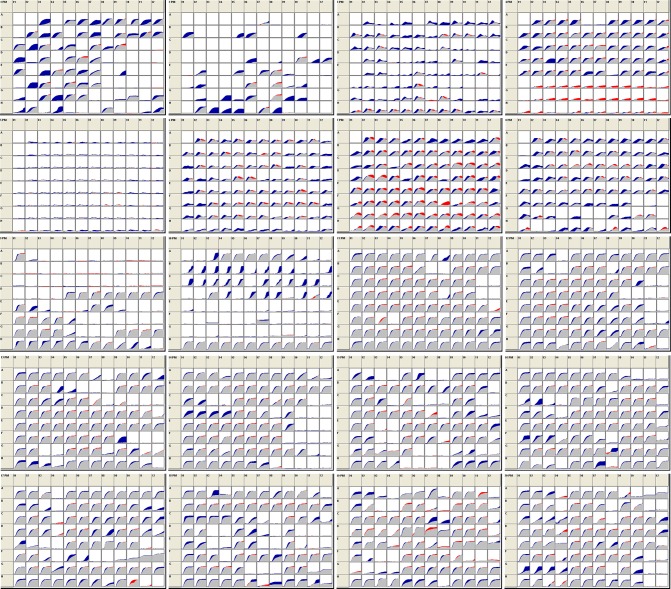
Fig 2. Phenotypic microarray data.
The 20 PM plates are used to identify strain differences in ability to metabolize different sources of carbon, nitrogen, phosphorus or sulfur; or differences in sensitivity to antimicrobial conditions. Kinetic data were collected every 15 min for 48 h and the variant curves were compared, as shown. Gray: overlapping activity; blue area: greater Smooth response; and red area: greater Rough activity.

