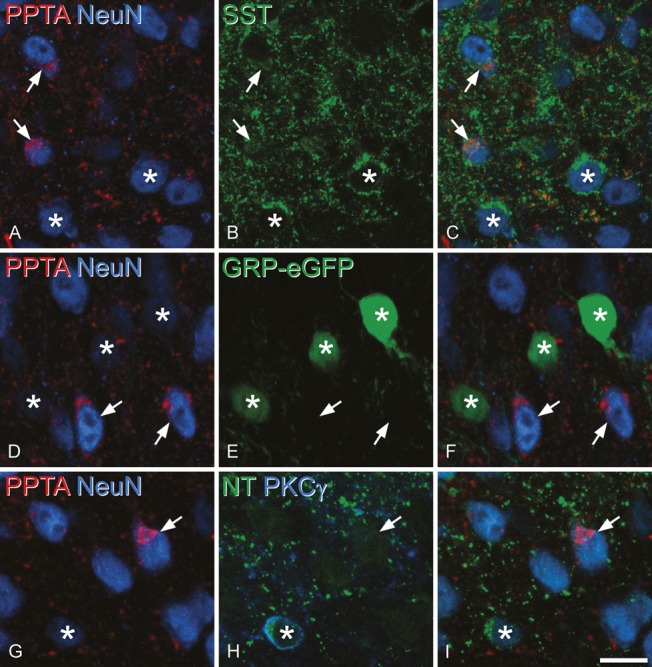
Figure 4.

Neurochemical characterisation of preprotachykinin A (PPTA)–immunoreactive cells. (A–C) Immunostaining for PPTA (red), NeuN (blue), and somatostatin (SST, green) reveals neurons with both PPTA and somatostatin in their perikaryal cytoplasm (2 indicated with arrows), as well as cells that are only positive for somatostatin (2 marked with asterisks). (D–F) A section from a gastrin-releasing peptide enhanced green fluorescent protein (eGFP) mouse stained for eGFP (green), PPTA (red), and NeuN (blue). The PPTA-immunoreactive cells (2 shown with arrows) were completely separate from eGFP+ cells (3 marked with asterisks). (G–I) A section immunostained to reveal PPTA (red), NeuN (blue), neurotensin (NT, green), and protein kinase C (PKC) γ (blue). (G) The section has been scanned to reveal PPTA and NeuN and shows a cell that is PPTA immunoreactive (arrow), as well as several that are PPTA negative (one of which is marked with an asterisk). (H) The same field scanned to reveal neurotensin and PKCγ. The cell marked with the arrow is negative for both markers. The cell with the asterisk is immunoreactive for both PKCγ (which labels the plasma membrane) and neurotensin (which is in the perikaryal cytoplasm). (I) A merge of PPTA, NeuN, and neurotensin confirms that PPTA and neurotensin are in different neurons. Images in (A–C) are projections of 4 optical sections at 0.5 μm z-spacing; those in (D–F) are projections of 2 optical sections 1 μm apart; those in (G–I) are projections of 3 optical sections at 0.5 μm z-spacing. Scale bar = 10 μm.
