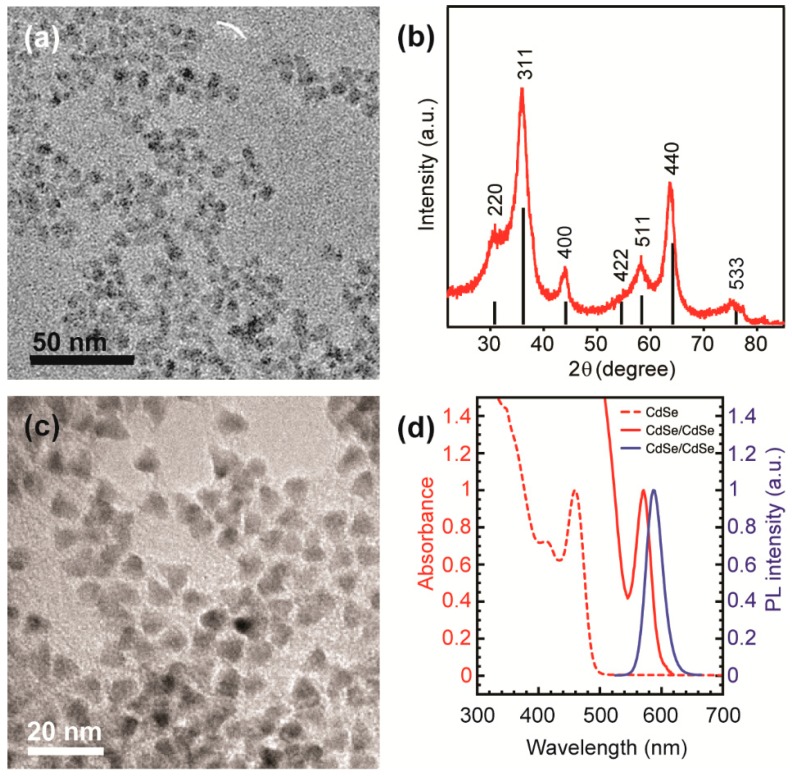
Figure 1.
(a) Overview transmission electron microscopy (TEM) image of colloidal γ-Ga2O3 nanocrystals (NCs) having an average dimeter of ca. 5.5 nm; (b) X-ray diffraction (XRD) pattern of the same NCs; vertical black lines represent a reference XRD pattern of bulk γ-phase Ga2O3; (c) Overview TEM image of ca. 6.8 nm CdSe/CdS core/shell NCs; (d) Absorption (red) and photoluminescence (PL) (blue) spectra of CdSe/CdS NCs (solid lines), and the absorption spectrum of the corresponding CdSe NC cores (red dashed line).

