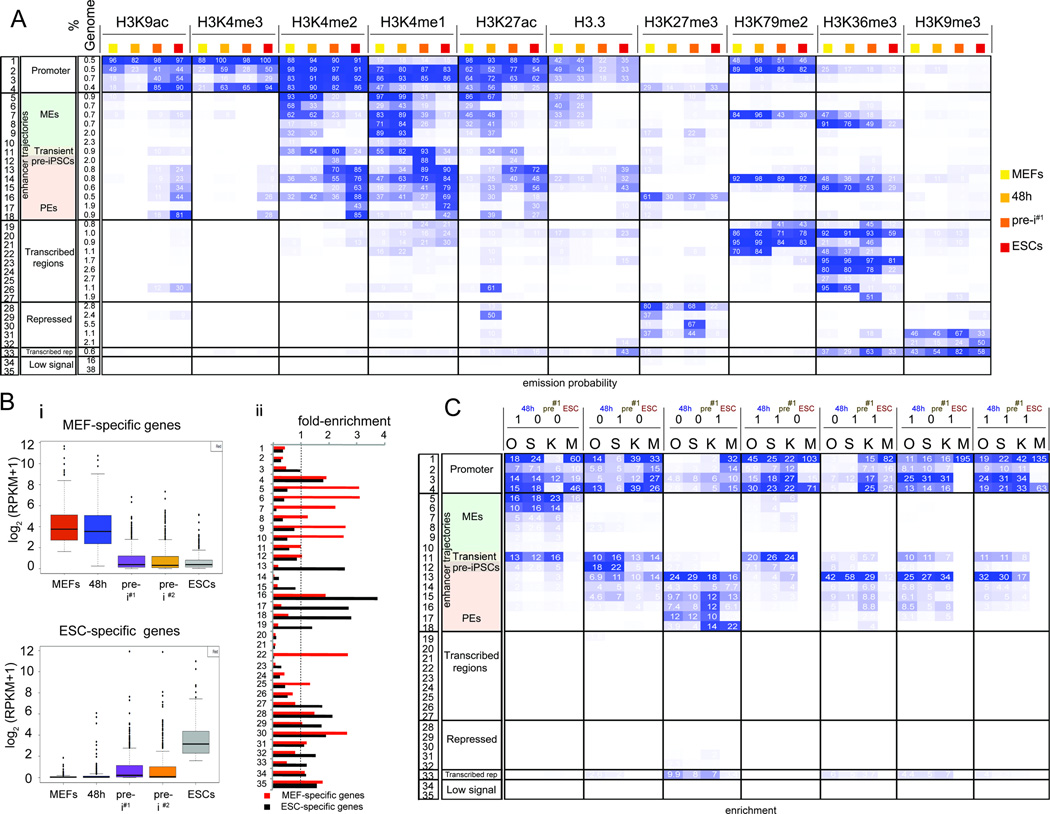
Figure 3. OSK redistribution mirrors enhancer reorganization.
A) Definition of the 35 chromatin trajectories that capture the major chromatin changes during reprogramming. The first three columns give the number, functional annotation, and genome fraction of each trajectory. Following columns are organized by histone mark and sub-ordered by reprogramming stage displaying the frequency of each mark per reprogramming stage and trajectory, colored from 0 (white) to 100 (blue).
B) (i) Boxplots of expression levels of MEF- and ESC-specific genes per reprogramming stage. (ii) Relative enrichment of each trajectory defined in (A) within +/− 20kb of the TSS of MEF- and ESC-specific genes compared to +/− 20kb of the TSS of all active genes. Values above the dashed line indicate higher enrichment in MEF- and ESC-specific genes, respectively.
C) Fold-enrichment of stage-specific and constitutive O, S, K, and M binding events defined in Fig 2D for each trajectory in (A), colored per column from highest to lowest.
See also Fig S4.

