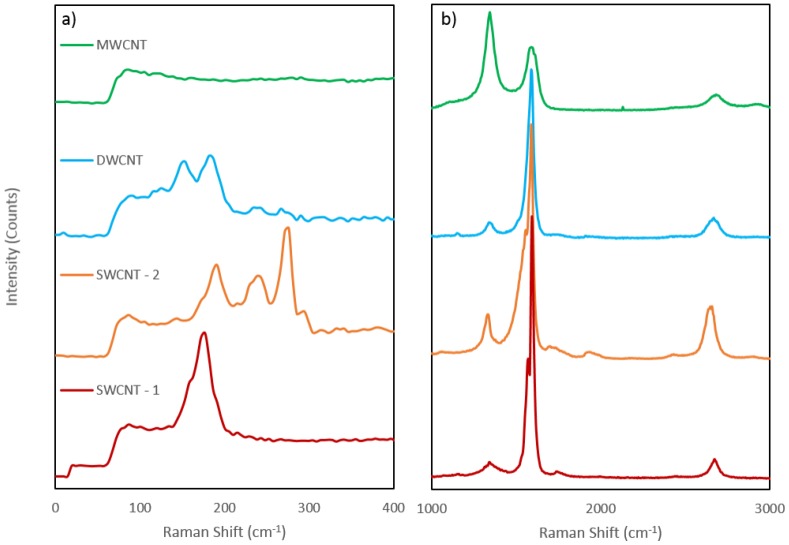
Figure 3.
(a) Low wavenumber region of the Raman spectra for all CNT samples showing the D, G, G′ and Breit-Wigner-Fano (BWF) bands, the intensity values have been offset to allow for easier viewing. (b) High wavenumber region of the Raman spectra for all CNT samples, showing the radial breathing mode (RBM) region. The intensity values have been offset to allow for easier viewing.

