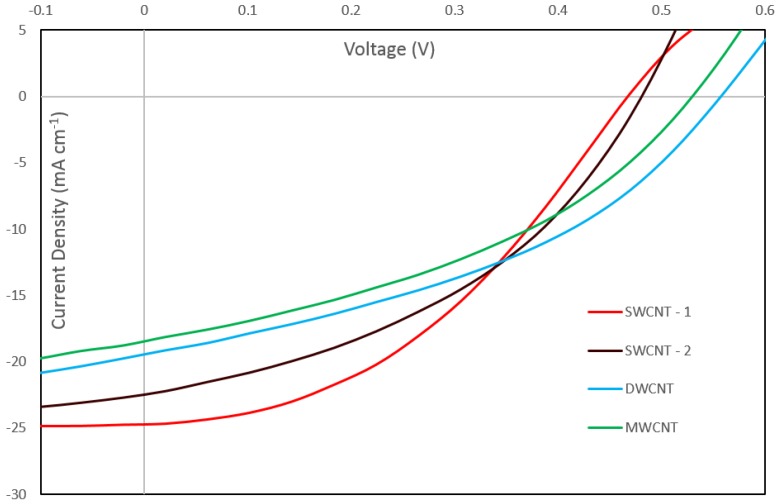
Figure 4.
Current density vs voltage (J/V) curves for best performing cells for each CNT sample after the second HF etch. Curves for two single-walled carbon nanotube samples (SWCNT-1 and SWCNT-2), one double-walled carbon nanotube sample (DWCNT) and one multi-walled carbon nanotube sample (MWCNT) are shown.

