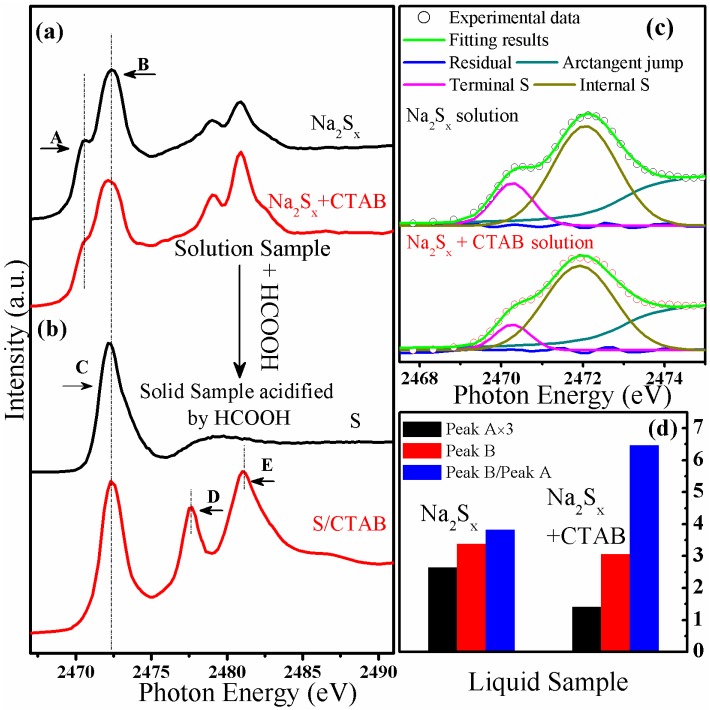
Figure 1.
S K-edge X-ray absorption spectroscopy (XAS) data of (a) Na2SX and Na2SX + cetyltrimethylammonium bromide, CH3(CH2)15N+(CH3)3Br− (CTAB) solutions, (b) the precipitates collected from the acidified solutions. The fitting of the lower energy region of the spectra of (a) is shown in (c), while the intensities of peaks A and B and the ratio of Peak B/Peak A are shown in (d).

