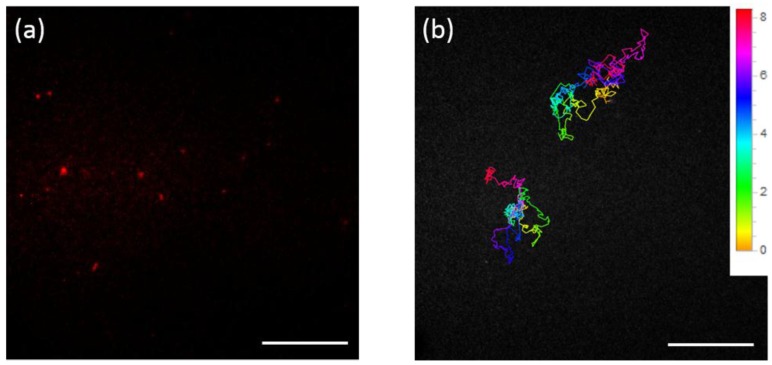
Figure 3.
(a) Fluorescence image of the surface of a single cell treated with FND-HPG-Amp particles. Bright red spots indicate the fluorescence from FNDs; (b) Molecule trajectories of two FND-labeled IL-18Rα recorded for ca. 8 s. The color code of the trajectory shows the time course, as indicated on the right side. Scale bar shows 10 μm. Movies are provided in supplementary material.

