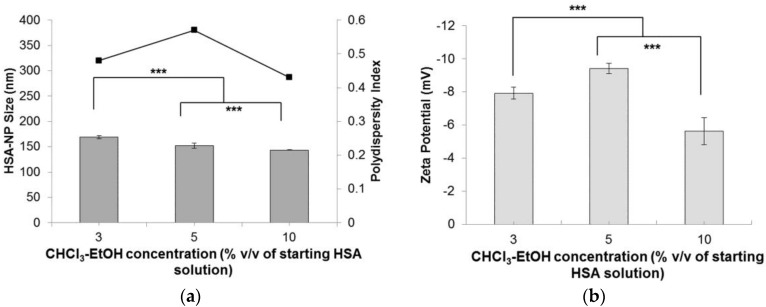
Figure 5.
Effect of chloroform-ethanol concentration (% v/v of starting HSA solution) on the (a) HSA-NP size (mean ± SD, n = 10), represented as columns, and polydispersity index , represented as line; (b) zeta potential of HSA-NPs (mean ± SD, n = 10), represented as columns, prepared from a 10 mg/mL HSA concentration, 20,000 psi homogenization pressure and 12 homogenization cycles (*** p < 0.0001; ns = not significant).

