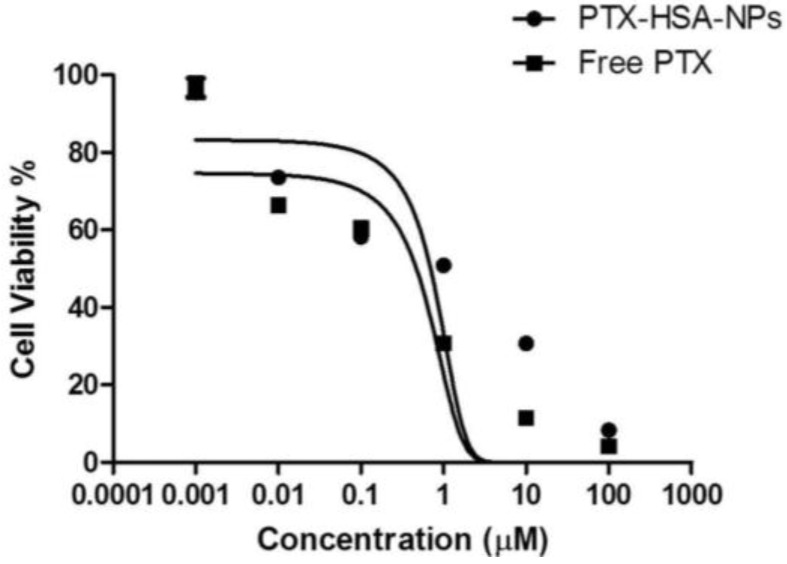
Figure 10.
Cell viability for PTX-HSA-NPs and free PTX in MCF-7 breast cancer cells with the mean ± 95% confidence interval. The graph was fitted using a nonlinear regression model in GraphPad Prism software version 5.01 (GraphPad Software Inc., La Jolla, CA, USA) and IC50 was calculated using the dose-response inhibitory equation.

