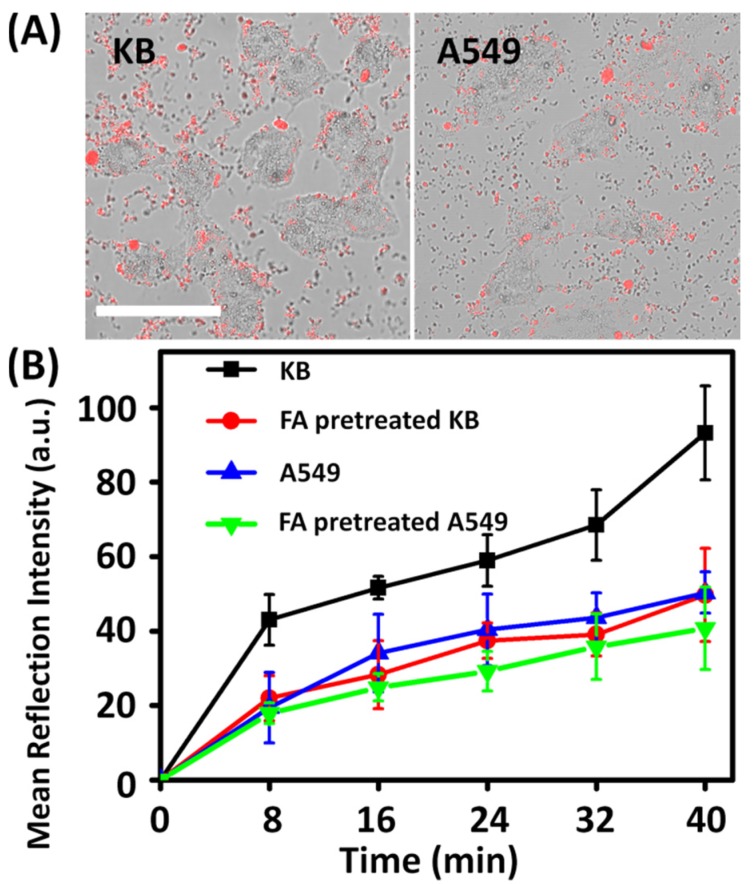
Figure 3.
(A) Confocal microscopic images of human nasopharyngeal carcinoma (KB) and human pulmonary adenocarcinoma (A549) cells treated with N-TiO2-FA (red) for 40 min. Scale bar is 50 μm. (B) Reflection intensity of internalized N-TiO2-FA in KB (black), FA-pretreated KB (red), A549 (blue) cells and FA-pretreated A549 (green) as a function of incubation time.

