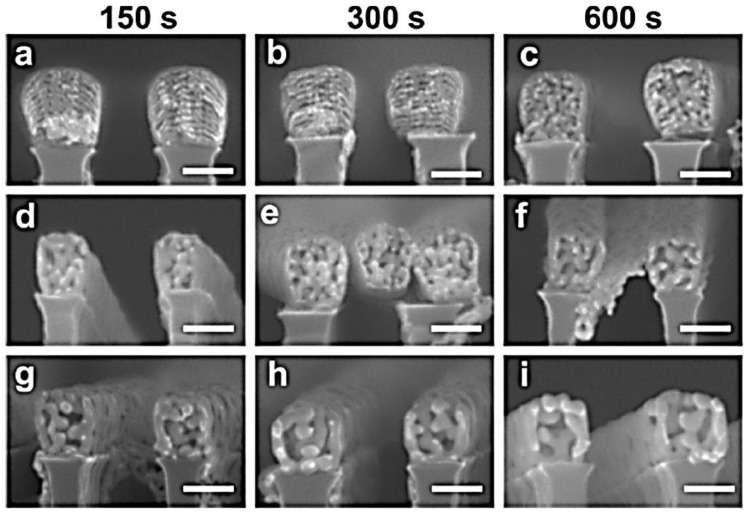
Figure 12.
Cross-sectional SEM micrographs showing the morphological evolution of Au–Cu nanowires with an initial Au content of 11 atomic % and a diameter of 200 nm as a function of the dealloying time and potential. Different dealloying potentials were explored: (a–c) 0.2; (d–f) 0.3; and (g–i) 0.4 V. Scale bar: 100 nm. Reproduced with permission from [113]. Copyright American Chemical Society, 2016.

