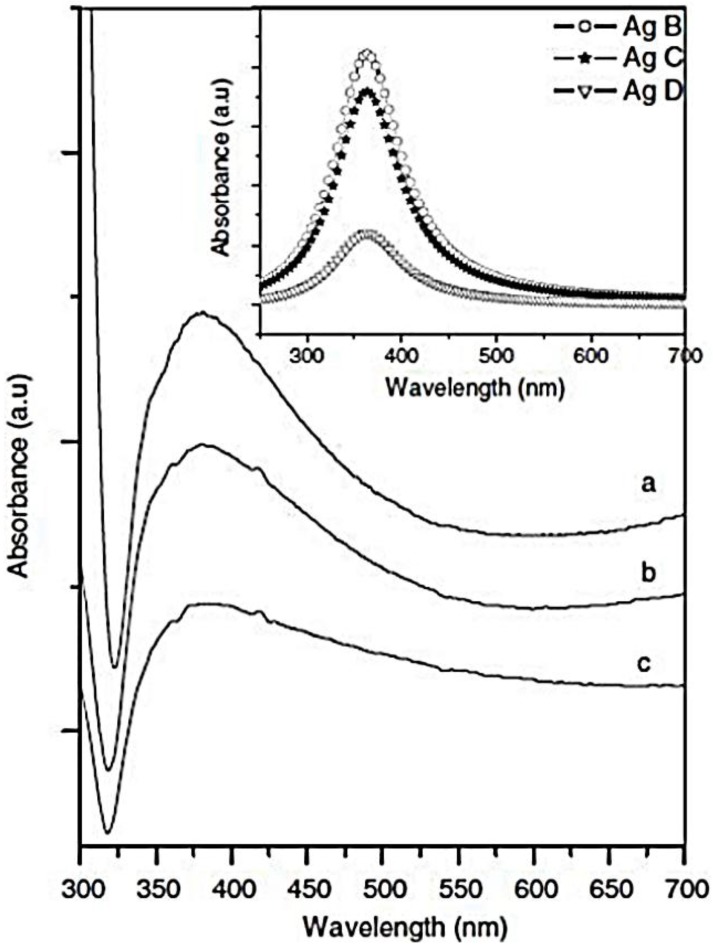
Figure 15.
UV-vis absorption spectra of the samples: (a) Ag B, 0.3 M aqueous NH3 solution; (b) Ag C, 0.6 M aqueous NH3 solution and (c) Ag D, 1.2 M aqueous NH3 solution. The inset reports the simulated absorption spectrum from the Mie theory for the samples. Reproduced with permission from [139]. Copyright Institute of Physics, 2007.

