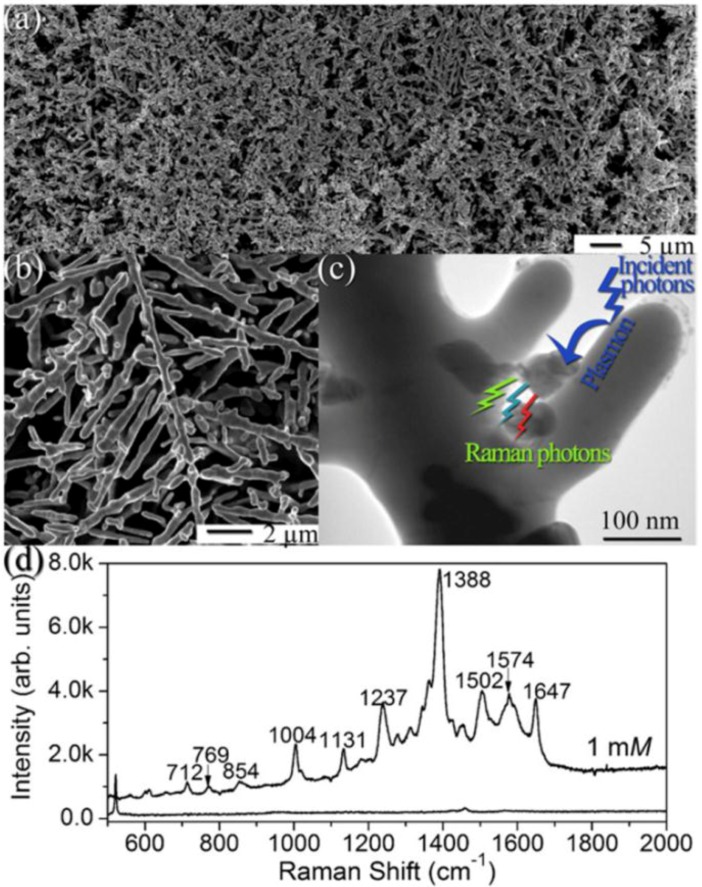
Figure 16.
(a) Large-scale SEM image and (b) magnified image of silver nano-dendrites; (c) typical TEM image of C60 nanoclusters coupled with silver dendrite. The inset shows a schematic SERS process; light is coupled with a plasmon leading to an interaction and this is then Raman scattered by C60 nanoclusters on the surface of silver dendrite, and the outgoing plasmon is then scattered back into a photon; (d) SERS spectrum of C60 nanoclusters coupled with silver dendrites from a solution of 1 mM C60 in toluene. The Raman spectrum at the bottom corresponds to the sample of C60 nanoclusters coupled with Si wafer from 1 mM C60 toluene solution. Reproduced with permission from [143]. Copyright Institute of Physics, 2009.

