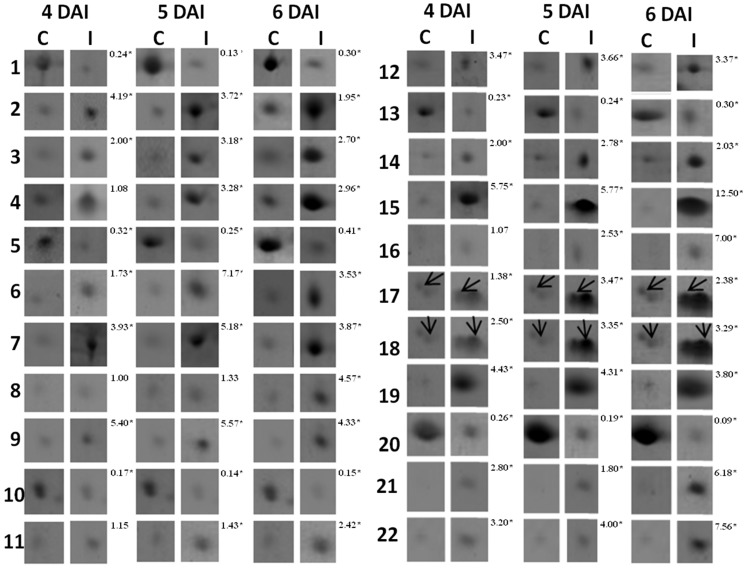
Figure 2.
Enlarged views of the up- and down-represented proteins that were identified in the roots of the cowpea genotype CE-31 inoculated with M. incognita (Race 3) and the non-inoculated control. Numbers at the left correspond to those protein spots denoted in Figure 1. Arrows are placed on Spots 17 and 18 to indicate that they appear in pairs, whose levels changed in response to M. incognita infection. Numbers at the right of every double column denote the mean of the protein fold change measured as the difference in intensity for each spot between root knot nematode (RKN)-infected and control plants from three gels using different biological samples. The asterisk on the numbers denotes significant difference (p ≤ 0.05) after application of the t-test.

