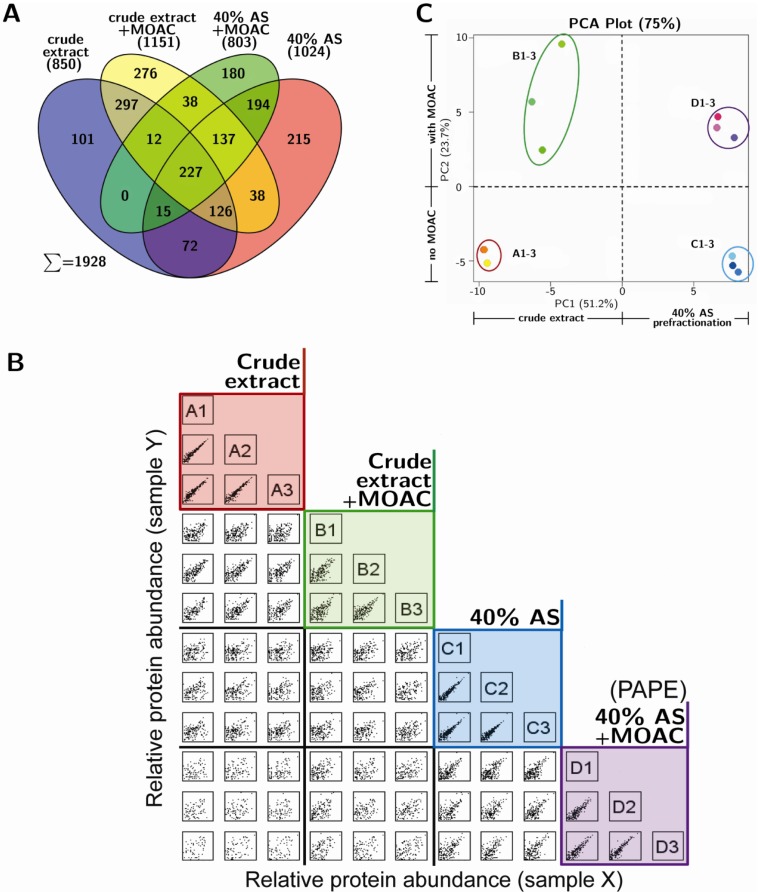
Figure 2.
Mass spectrometry analysis of proteins from the fractionation steps of the PAPE procedure. (A) Flower plot showing the qualitative differences in the protein composition of the various PAPE fractions. The numbers are the total number of proteins identified from three experiments, with each sample being measured twice; (B) Variability and reproducibility of the PAPE procedure. Each small square represents a scatter plot of protein abundance (quantitative values based on spectral counting, SCAFFOLD; DanteR [30]) of the intersecting samples from the various fractionation steps. The letters A–D denote crude extract, crude extract + MOAC, 40% AS and 40% AS + MOAC, respectively, and the numbers 1–3 correspond to the three replicate experiments for each fractionation step. Note the strong positive correlation within the three replicate experiments of each fractionation step (colored boxes); (C) Principal Component Analysis (PCA) plot. The dashed lines divide the plot into sectors along the weight of the principal components separating with/without prefractionation and MOAC phosphoprotein enrichment steps, respectively.

