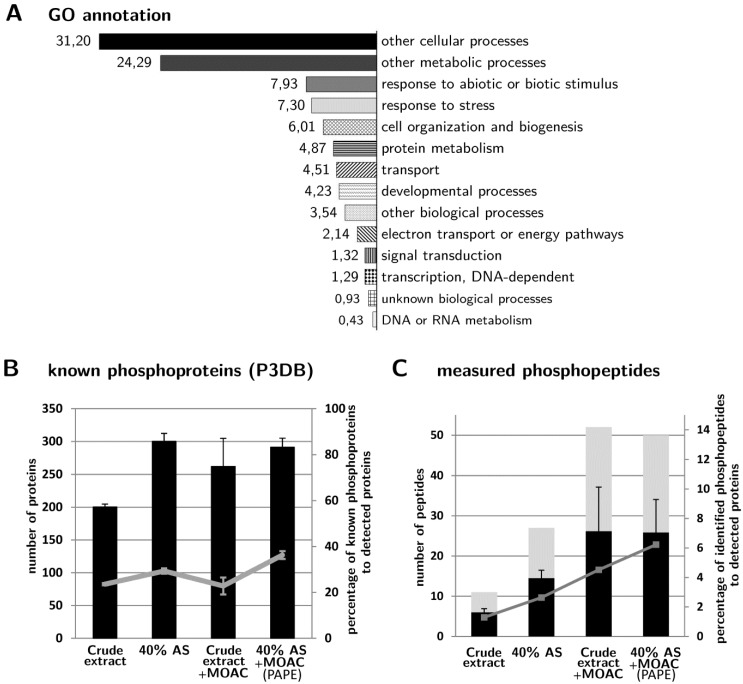
Figure 3.
Changes of the protein/phosphoprotein composition. (A) Gene ontology functional categorization (based on the The Arabidopsis Information Resource (TAIR) gene ontology (GO) web-tool) of the proteins detected with the PAPE procedure; (B) The number of identified proteins in the various fractionation steps that are annotated as known phosphoproteins in the P3DB database. The grey line represents the percentage of identified known phosphoproteins to the total number of identified proteins in each fraction (see Figure 2A); (C) The number of phosphopeptides identified in the various fractionation steps. (Only high-confidence phosphopeptides with a phosphorylation site probability (pRS) score >30 are considered; for a full list, see Table S2). Each experiment was performed three times and measured twice. Black bars are the average number of phosphopeptides (+/−standard deviation) detected in each fraction, while grey bars depict the total number of non-identical phosphopeptides identified from all replicates. The grey line depicts the percentage of identified phosphopeptides to the total number of identified proteins in each fraction.

