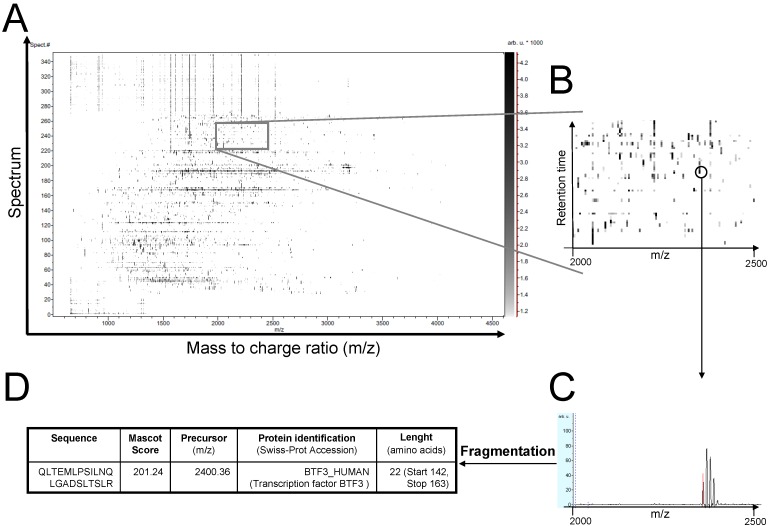
Figure 3.
2D-like view illustrating the distribution of the peptides according to their retention time vs. their m/z ratio. (A) print-screen image obtained from Warp-LC Survey Viewer (Bruker Daltonics) after RP-HPLC-MALDI-TOF-MS analysis of tryptic peptides issued from the enzymatic digestion of a sample of proteins extracted from brain capillary endothelial cells; (B) detail of a particular region; (C) selection of an ion; (D) fragmentation and identification of the peptide (unpublished data from the authors’ laboratory).

