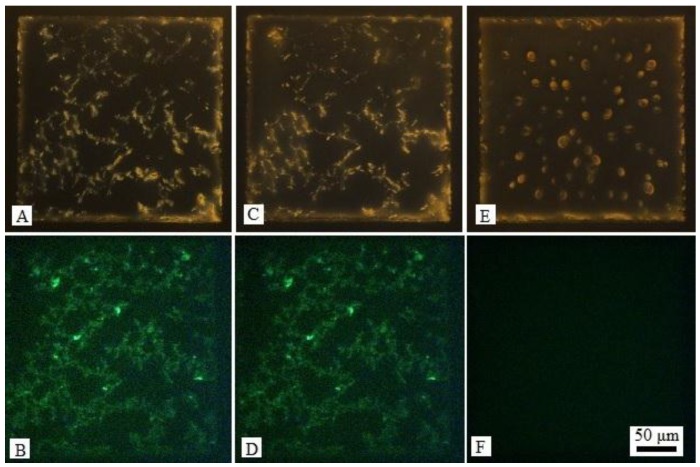
Figure 4.
(A) Optical images (crossed polars) and (B) corresponding fluorescence micrographs of LC-aqueous interface decorated with DNA-lipids and l-DLPC, and dyed by SYBR Green; (C) Optical images and (D) corresponding fluorescence micrographs after the introduction of 20 μM random DNA strands for 10 min in (A); (E) Optical images and (F) corresponding fluorescence micrographs after the introduction of 20 μM c-DNA of DNA-lipids for 3 min in (C).

