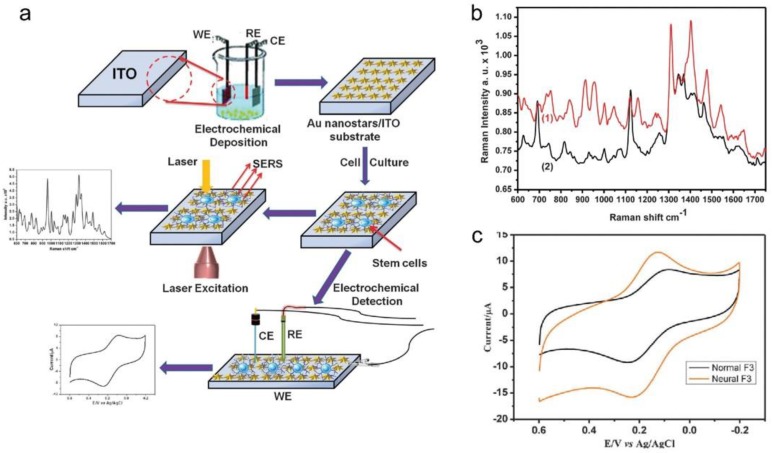
Figure 4.
(a) Schematic diagram showing the spectro-electrochemical-based neural stem cell differentiation monitoring sensor on a gold nanostar array; (b) Raman spectrum for (1) undifferentiated and (2) differentiated HB1.F3 cells within the range of 600 cm−1 to 1750 cm−1; (c) cyclic voltamogram for differentiated and undifferentiated HB1.F3 cells. (Modified from Ref. [52] with permission, Copyright 2015 The Royal Society of Chemistry, London, UK).

