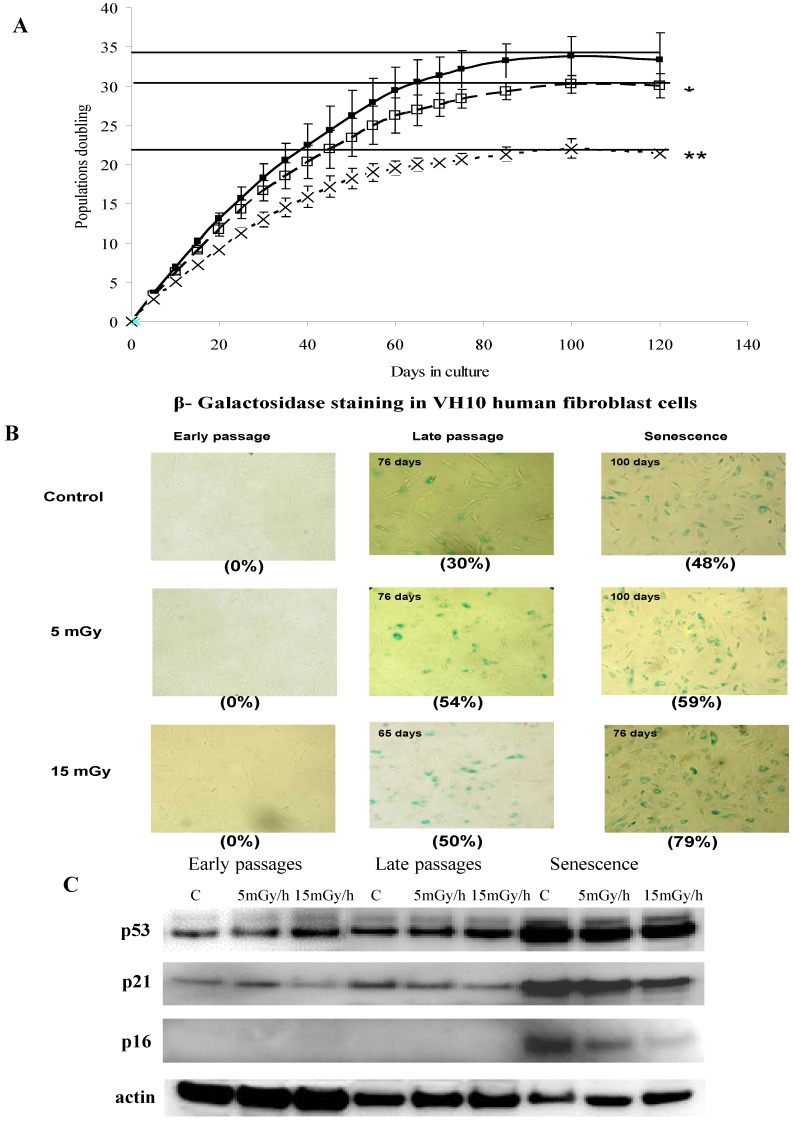
Figure 1.
Panel (A): Growth rate kinetics of VH10 cells in response to chronic dose of 5 (□) and 15 (×) mGy/h γ-rays as well as for non-exposed cells (■). The results are based on 3 independent experiments (n = 3) for each dose rate that were started from passage 12. The slopes of growth rate for each experiment have been calculated and used to test the significance between the growth rates of non-exposed and exposed cells; Panel (B): The senescence-associated β-galactosidase staining of VH10 cells. Fibroblasts at early (20 days of culture), late and senescent passages (days of culture as shown in C) were subjected to in situ SA-βgal staining at pH 6 and examined by bright field microscopy. Cellular senescence is evident by flattened cell morphology, growth arrest and augmented senescence-associated β-galactosidase activity (numbers in brackets represent percent of β-galactosidase active cells); Panel (C): Western blots showing the expression of p53, p21 and p16. VH10 cells were harvested at early-, late-passages and senescent stages. Total protein extract were subjected to SDS-PAGE and Western blotting. The membranes were developed with antibodies for p53, p21, p16 and actin as control. Data are representative of two independent experiments.

