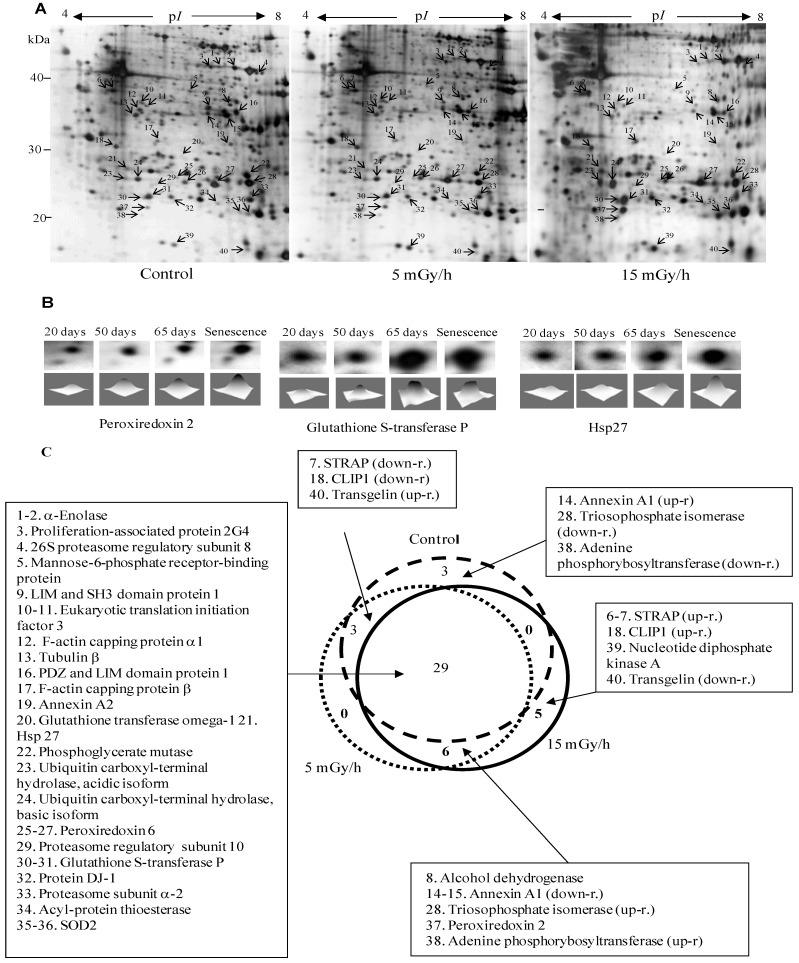
Figure 2.
Panel (A): Representative 2D maps of proteins in control VH10 cells and after 65 days of low dose chronic exposure. 100 µg proteins were loaded and separated in the first dimension by IEF on IPG strips with nonlinear pH 3–10 gradient, then in the second dimension by SDS/PAGE on 10% polyacrylamide gels. Proteins were revealed by silver nitrate staining. The numbered proteins were identified by mass spectrometry and listed in Table 1; Panel (B): 2D gel images showing selected up-regulated proteins after 20, 50, 65 and 76 days (senescence) chronic exposure at 15 mGy/h; Panel (C): The diagram presents comparison of numbers of senescence-associated proteins in the control and two irradiated samples.

