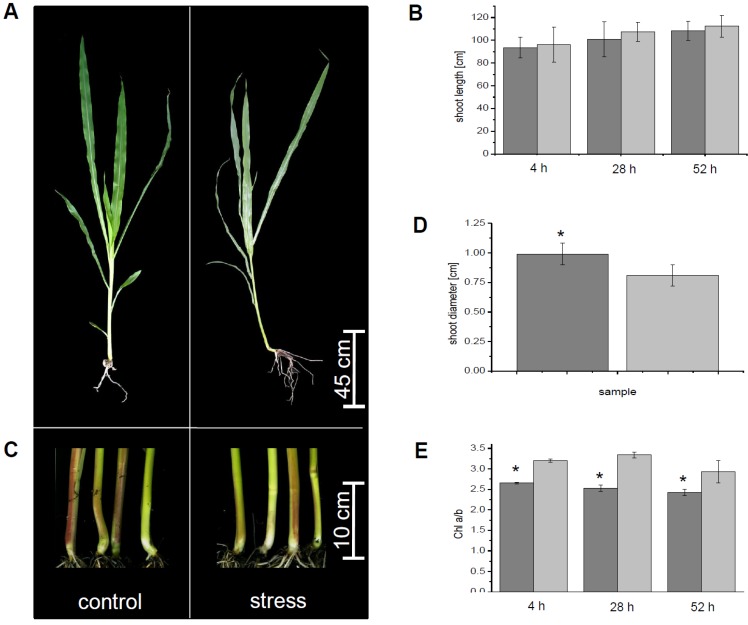
Figure 1.
Morphological adaption of maize to submergence. (a) Phenotype of control plants and plants stressed by submergence at the end of the growing period; (b) Shoot length was measured for control and stressed plants over the three days of flooding; (c) Shoot basis of control and submerged plants; (d) Comparison of basal shoots of control and stressed samples at the end of the experiment; (e) Chlorophyll a/b ratio. All measurements were done for n ≥ 20 biological replicates. Except for (e) measurements were done for n ≥ 5 biological replicates. Control, light grey, flooded plants, dark grey. Significant changes were marked with an asterisk.

