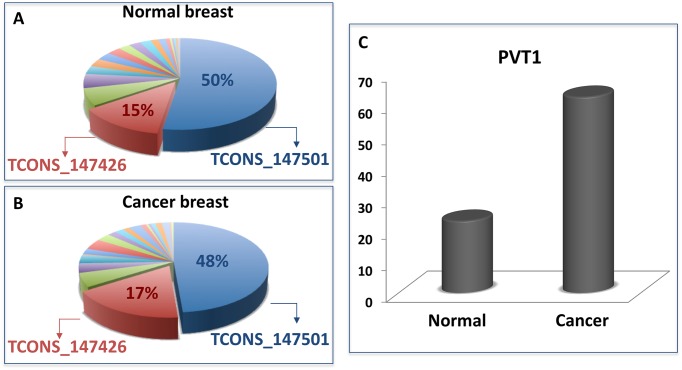
Fig 5. PVT1 isoforms in normal and cancer breast tissues.
The PVT1 abundance in terms of its isoforms in normal (A) and cancer tissues (B) of breast invasive carcinoma. The percentage are calculated with respect to the total abundance of PVT1 in normal and cancer tissues (S3 Table). In both panels, the red slice corresponds to the isoform (TCONS_147426) with seed match for the miR-200b/200c/429 cluster and the blue slice corresponds to the isoform (TCONS_147501) lacking the binding site for any member of the miR-200 family. (C) The average of PVT1 abundance on all the isoforms both in normal and cancer tissues.

