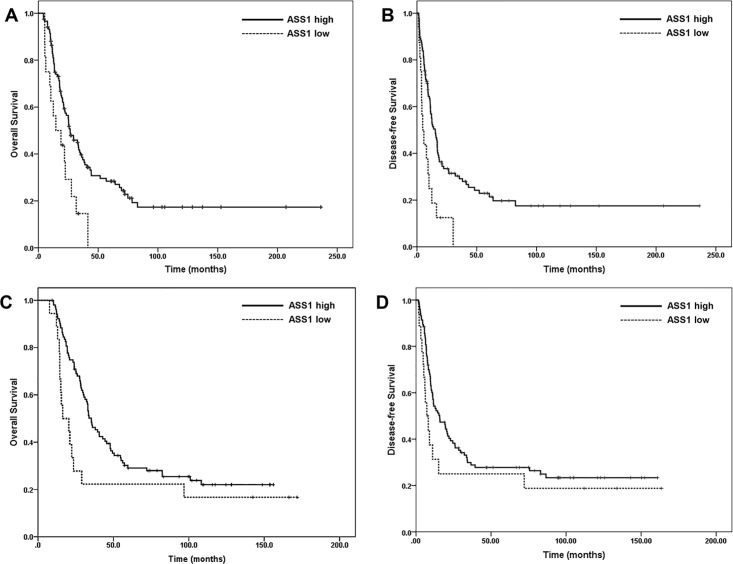
Fig 4.
Kaplan–Meier survival curves showing that low ASS1 expression (ASS1-low) is associated reduced overall survival (p = 0.005, A) and disease-free survival (p = 0.001, B) compared to those whose tumors are ASS1-high in the untreated cohort. (C) and (D) Kaplan–Meier survival curves showing that ASS1-low is associated reduced overall survival (p = 0.04, C), but not disease-free survival (p = 0.13, D) compared to those whose tumors are ASS1-high in the treated cohort.

