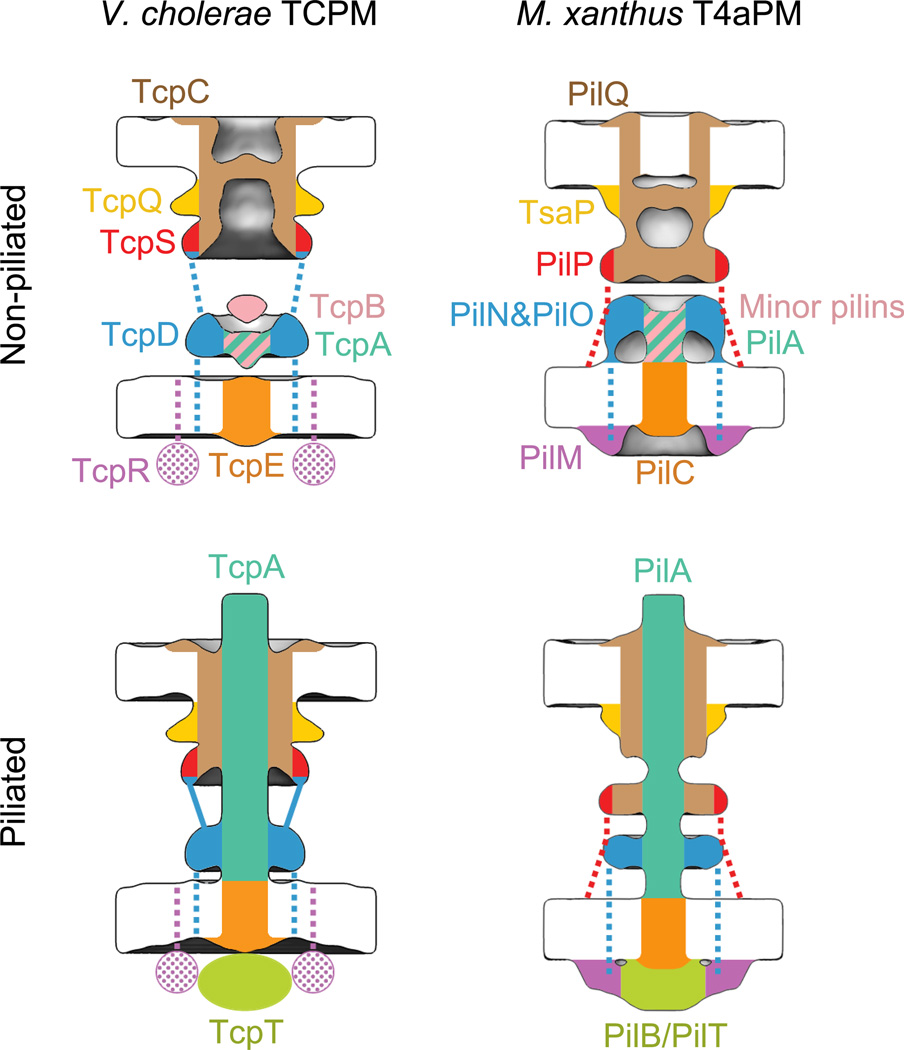
Figure 4. Locations of TCPM components and the comparison with M. xanthus T4aPM.
Left column: schematics showing the component locations assigned for the piliated and non-piliated V. cholerae TCPM (this study). Right column: schematics showing the component locations identified in the piliated and non-piliated M. xanthus T4aPM8. Dashed lines indicate known connections without visible electron density in sub-tomogram averages. Dotted colors indicate proposed protein locations.

