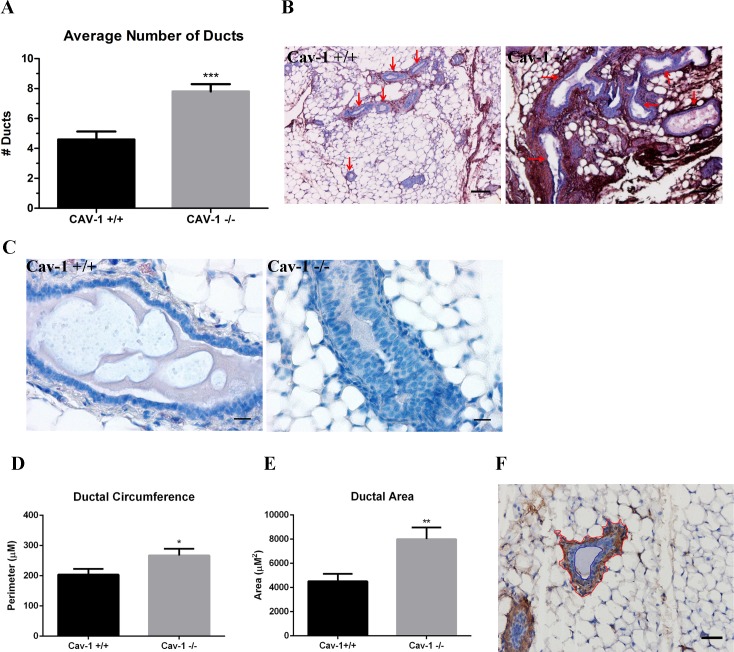
Fig 6. Ductal architecture is disrupted in cav-1 -/- glands.
(A) The number of ducts were enumerated in αSMA stained sections from cav-1 -/- and cav-1 +/+ glands. Results demonstrated a highly significant average number of ducts per image in cav-1 -/- glands in comparison to cav-1 +/+ glands. (B) Images of fibronectin stained sections illustrate the abundance of large, elongated, branched ducts (red arrows) in cav-1 -/- glands. Ducts in cav-1 +/+ glands appear small and relatively round (red arrows). Scale bars are 100μM. (C) H&E stained images of glands demonstrate the presence of stacked ductal epithelial cells in cav-1 -/- sections, indicative of ductal hyperplasia. Cav-1 +/+ glands exhibit a continuous monolayer of ductal epithelial cells. Scale bars are 20μM. (D) The ductal circumference, measured as the region immediately outside the myoepithelial compartment, was analyzed in αSMA stained sections in cav-1 -/- and cav-1 +/+ glands. The ductal circumference was significantly greater in cav-1 -/- as opposed to cav-1 +/+ glands. (E) The area, measured as the region between the myoepithelial and luminal compartment, was analyzed in αSMA stained sections in cav-1 -/- and cav-1 +/+ glands. The ductal area was significantly greater in cav-1 -/- as opposed to cav-1 +/+ glands. (F) This image of an αSMA stained cav-1 +/+ duct illustrates the vectors used to assign stromal and lumen outlines used to analyze ductal measurements. The red line shows the stromal border while the blue line shows the lumen border. Scale bar is 50uM. *p≤0.05, **p≤0.01, ***p≤0.001. Results are reported as the mean ± the SEM.

