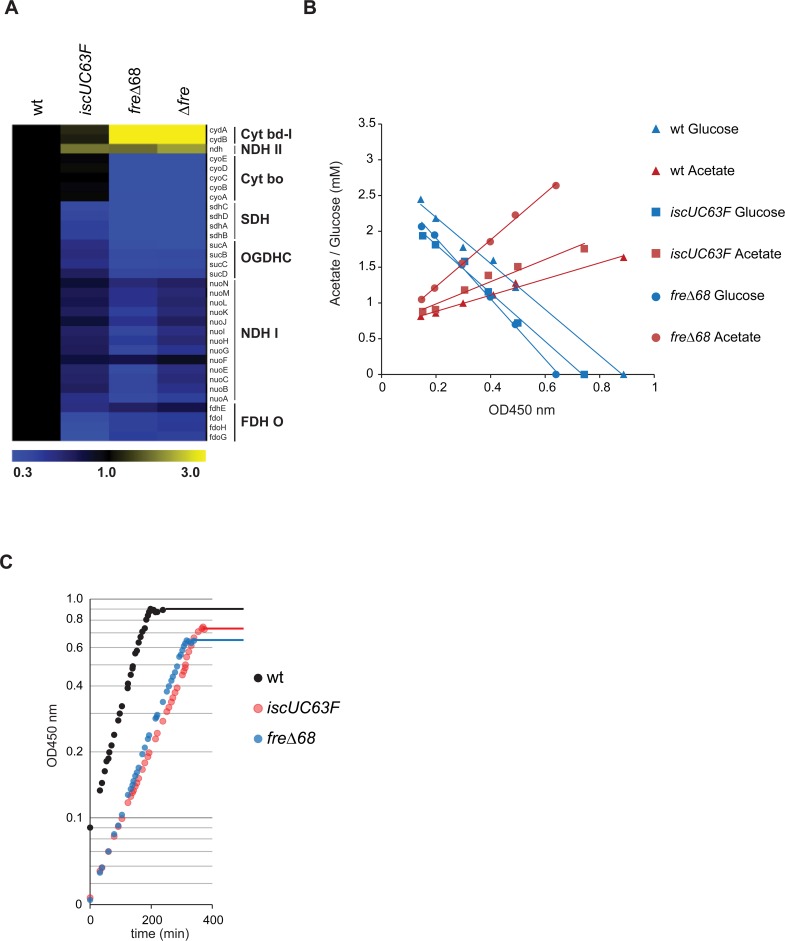
Fig 3. The respiro-fermentative metabolism of IscUC63F and freΔ68 mutant cells.
A) Expression profiles of genes involved in the respiratory chain as obtained by whole genome microarray. Expression intensities relative to wild-type are displayed by a two color gradient from blue (low) to yellow (high). Shown, the expression profile of operons encoding succinate dehydrogenase (SDH), 2-oxoglutarate dehydrogenase (OGDHC), NADH dehydrogenase I (NDH-I) and II (NDH-II), formate dehydrogenase (FDH O), cytochrome o oxidase (Cyt bo) and bd-1 (Cyt bd-1). B) Measurement of glucose consumption and acetate production during growth in glucose limited medium (AB minimal medium supplemented with 0.04% glucose). The plot shows the concentration of glucose (blue symbols), and acetate (red symbols) over optical density (no lactate, formate, citrate, ethanol and succinate were detected). Samples for final optical density for wild-type, IscUC63F and freΔ68 were measured at growth arrest (OD450 nm 0.88, 0.75, 0.64 respectively). C) Growth of wild-type, IscUC63F and freΔ68 cultures in AB minimal medium supplemented with 0.04% glucose.

