
Extended Data Figure 6.
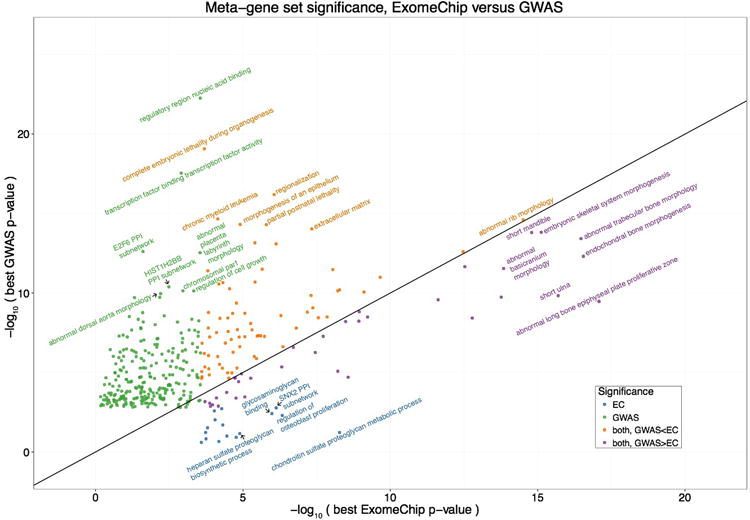
Comparison of DEPICT gene set enrichment results based on coding variation from ExomeChip (EC) or non-coding variation from genome-wide association study data (GWAS). The x-axis indicates the P-value for enrichment of a given gene set using DEPICT adapted for EC data, where the input to DEPICT is the genes implicated by coding EC variants that are independent of known GWAS signals. The y-axis indicates the P-value for gene set enrichment using DEPICT, using as input the GWAS loci that do not overlap the coding signals. Each point represents a meta-gene set, and the best P-value for any gene set within the meta-gene set is shown. Only significant (false discovery rate < 0.01) gene set enrichment results are plotted. Colors correspond to whether the meta-gene set was significant for EC only (blue), GWAS only (green), both but more significant for EC (purple), or both but more significant for GWAS (orange), and the most significant gene sets within each category are labeled. A line is drawn at x = y for ease of comparison.