
Extended Data Figure 8.
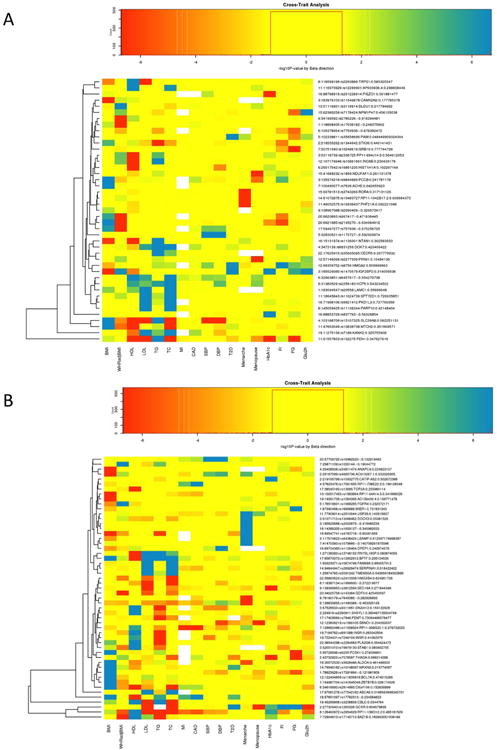
Heatmaps showing associations of the height variants to other complex traits; −log10(P-values) are oriented with beta effect direction for the alternate allele, white are missing values, yellow are non-significant (P>0.05), green to blue shading for hits with positive beta in the other trait and P-values between 0.05 and <2×10⁻⁷ and, orange to red shading for hits with negative beta in the other trait and P-values between 0.05 to <2×10⁻⁷. Short and tall labels are given for the minor alleles. Clustering is done by the complete linkage method with Euclidean distance measure for the loci. Clusters highlight SNPs that are more significantly associated with the same set of traits. (A) Variants for which the minor allele is the height-decreasing allele. (B) Variants for which the minor allele is the height-increasing allele.