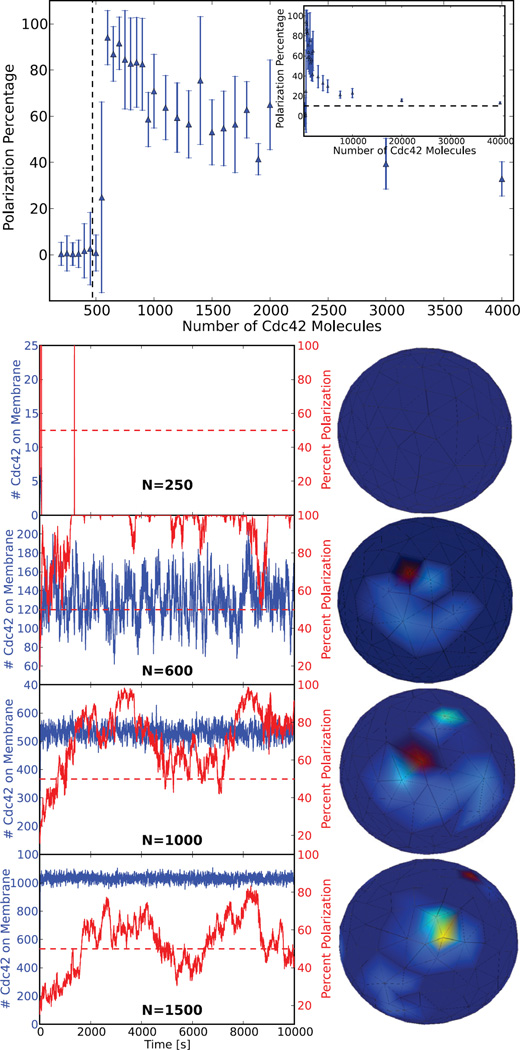
Fig. 6.
The results of a parameter sweep over the number of Cdc42 signaling molecules, N, with volume held constant, performed in parallel. Each model with a given parameter value of N was run to time 10, 000 seconds. Plotted (top) is the time average of the maximum percent of Cdc42 molecules found in any region corresponding to 10 percent surface area on the cell membrane for each N value, with error bars depicting the standard deviation. The dotted line represents the theoretical switch location calculated from [20]. The model captures both the theoretical density dependent switch behavior and the asymptotic decrease to a homogeneous distribution, which corresponds on average to a maximum of 10 percent of molecules in any 10 percent region on the membrane. Plotted (bottom) is explicit polarization percentage and number of Cdc42 molecules versus time for various values of N along with a characteristic 3D visualization for each. It is important to note that at N = 250 there is no membrane bound Cdc42, as it all remains in the cytoplasm throughout the simulation, which will always be the case below the switch value.

