
Figure 4. Immune cell subset analysis of HPV(+) and HPV(−) tumors.
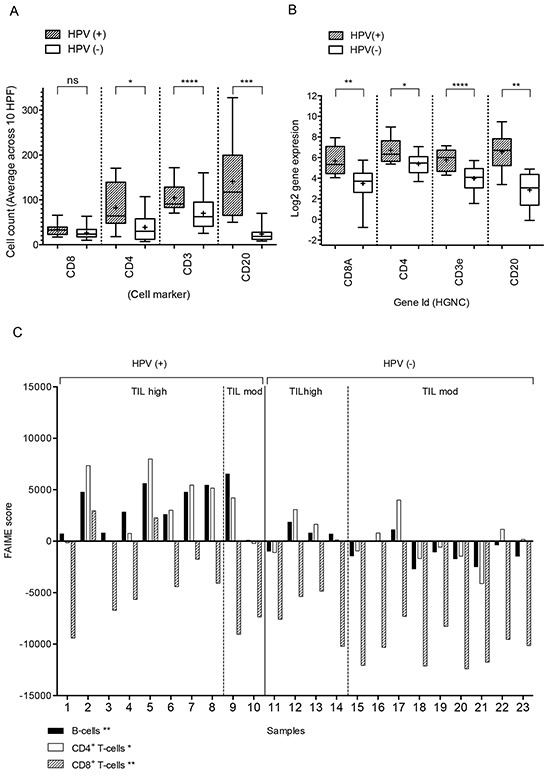
A. The distribution of CD4, CD8, CD3 and CD20-expressing cells in HPV(+) and HPV(−) tumors as detected by IHC; cell counts are given as a mean of 10 high-power fields. B. Gene expression of CD4, CD8A, CD3E and CD20 of HPV(+) and HPV(−) tumors displayed as box plots (min/max) with the + representing the mean*. Differences in TIL density between HPV(+) and HPV(−) tumors are observed both by gene expression profiling and IHC analysis. C. the FAIME score of lymphocytes in HPV(+) and HPV(−) tumors; the difference in distribution of specific cell subsets based on ranked gene expression is shown. Asterisks in column labels indicate a significance level of two-sample t-test comparisons of FAIME scores between HPV(+) and HPV(−) tumors: *P <0.05 and **P <0.01). *Gene expression data from the normalized transcript counts; data was normalized using the TMM method followed by variance stabilizing transformation of the TMM normalized data.