
Fig. 3. In vitro motility data for the three mutant human β-cardiac sS1 proteins compared to WT.
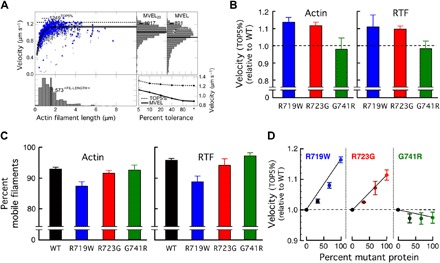
(A) An example of automatic analysis of an in vitro motility movie with FAST (11) (available for download at http://spudlab.stanford.edu). Scatterplot of actin filament velocities as a function of filament length (gray, all velocity points for each filament; blue, maximum velocity of each filament). The dashed line indicates the TOP5% of filament velocities. At the top right, two histograms of velocities are shown: a histogram of all filament velocities with its MVEL marked as a black line and a histogram of velocities with tolerance filtering to eliminate intermittently moving filaments with a velocity dispersion higher than 20% of their mean within a five-frame window (MVEL20). At the bottom right, the effects of various levels of tolerance filtering on the TOP5% and the MVELs are shown. (B) The TOP5% velocities relative to WT for gliding actin filaments (left) or RTFs (in 10−5 M Ca2+) (right) driven by the three mutant human β-cardiac sS1 proteins. Each mutant protein was normalized against its matching WT protein prepared and assayed on the same days. Each bar graph is a mean of relative velocity (error bars represent ±95% confidence interval). (C) The percent mobile filaments for the velocity measurements using WT and mutant human β-cardiac sS1 proteins, for actin (left) and RTFs (right). Data are presented as means ± SEM. (D) In vitro motility assays with mixtures of WT and mutant protein at varying ratios.