
Fig. 2. Evaluation scheme illustrating robust reconstruction.
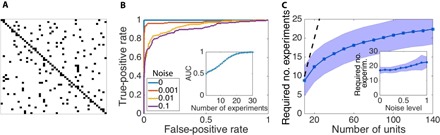
(A) Representative adjacency matrix indicating network connectivity as defined by present (black) and absent (white) links. (B) ROC curve obtained by varying a threshold Jc separating links classified as existing from those classified as absent (see note S3). The AUC increases with decreasing noise level, with perfect ranking of reconstructed links in the limit of noiseless dynamics. Inset: The quality of network reconstruction, as specified by the AUC, increases with the number of driving-response experiments. (C) The number of experiments required for high-quality reconstruction (here, AUC > 0.95) increases sublinearly (compared to the dotted line) with network size and (inset) changes only weakly with the noise level. Data are shown for random networks of (default size) N = 50 Goodwin oscillators with a regular incoming degree of 4, a default noise level of 0.5, a default number of experiments of 25, and a number of sampled time points of 100; shading indicates SD across ensembles of network realizations.