. 2017 Jan 9;6:e22520. doi: 10.7554/eLife.22520

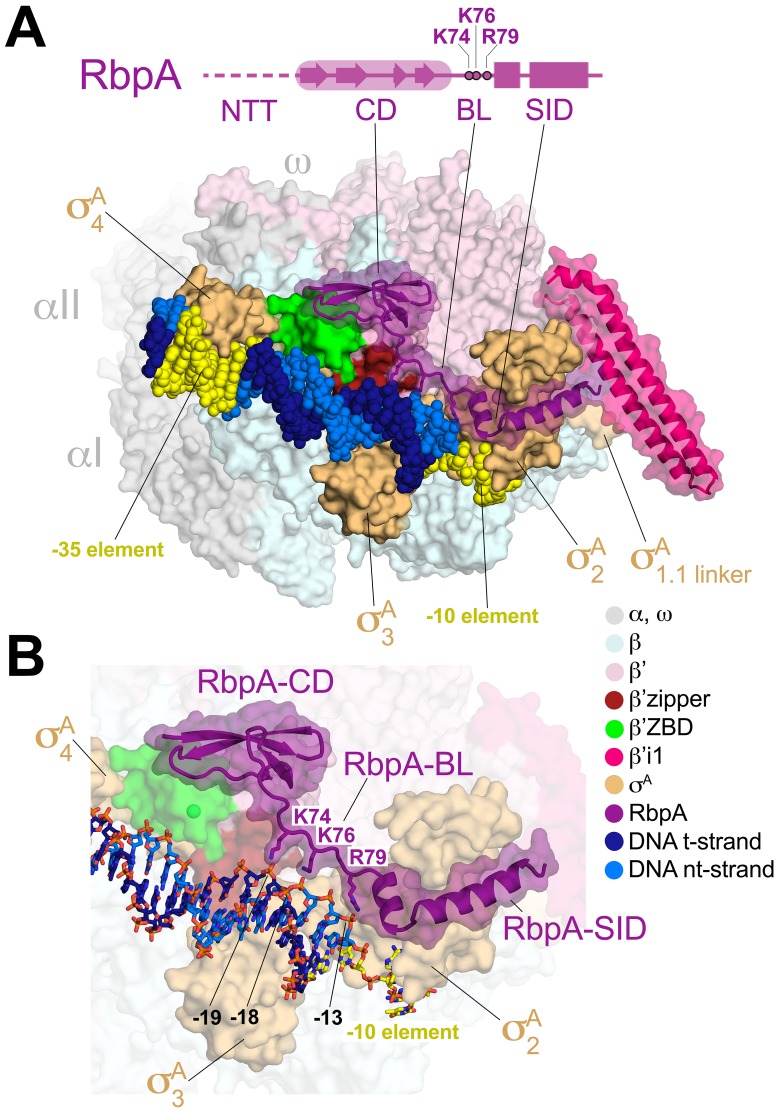
Figure 1. Structure of the Msm RbpA/TIC.

(A) (top) The RbpA structural architecture is represented schematically. The CD is shown as a thick region, with β-strands represented as arrows. The α-helices of the SID are shown as rectangles. Linker regions lacking secondary structure, the NTT and BL, are represented by a thin line. The NTT is disordered in the crystal structure and is shown as a dashed line. Conserved basic residues in the BL (K74, K76, R79) that interact with the DNA phosphate backbone are denoted. (bottom) Overall structure of the Msm RbpA/TIC. The color-coding of most of the structural features is denoted in the legend. Protein components (core RNAP, σA, RbpA) are shown as molecular surfaces. The surfaces of RbpA and the lineage-specific insert β’i1 are transparent, revealing the α-carbon backbone ribbon underneath. RbpA side chains K74, K76, and R79 are shown in stick format. The DNA is shown as CPK atoms, with the −35 and −10 elements colored yellow. (B) Magnified view of the region including RbpA and the promoter DNA near the −10 element. The DNA is shown in stick format. The β’ZBD surface is transparent with the Zn2+-ion shown as a sphere.

DOI: http://dx.doi.org/10.7554/eLife.22520.002

Figure 1.

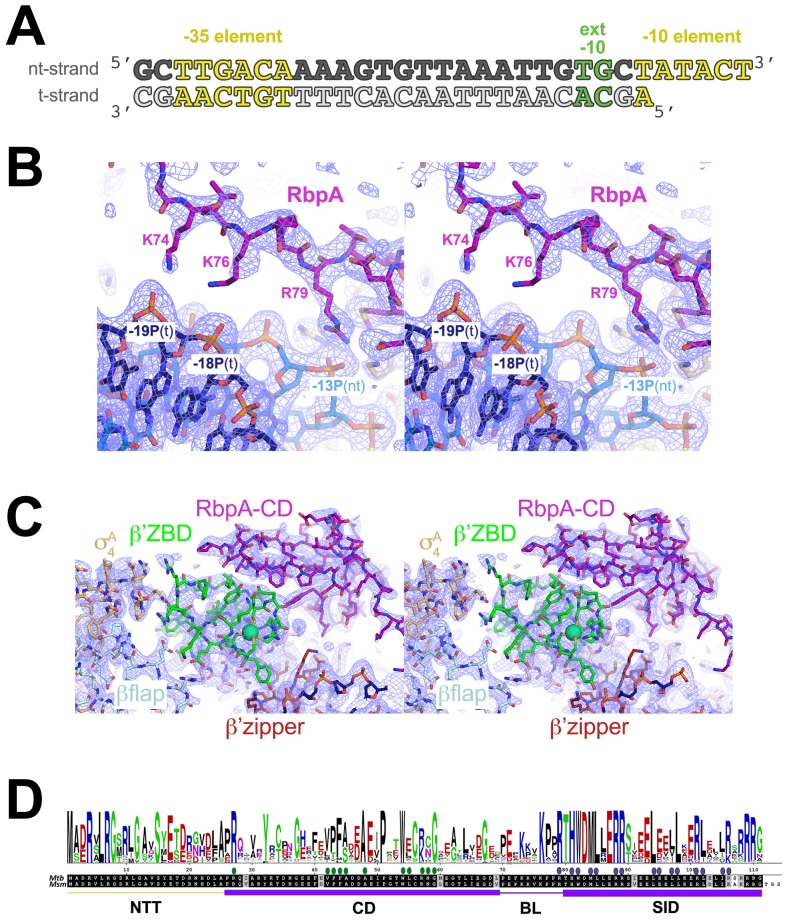
Figure 1—figure supplement 1. Crystallization oligonucleotides, electron density maps, and RbpA sequence conservation.

Figure 1—figure supplement 1.

(A) Synthetic oligonucleotides used for the Msm RbpA/TIC crystallization. The DNA sequence is derived from the full con promoter (Gaal et al., 2001). The nt-strand DNA (top strand) is colored dark gray; the t-strand DNA (bottom strand), light grey. The −35 and −10 elements are shaded yellow. The extended −10 (Keilty and Rosenberg, 1987) is colored green. (B) Stereo view of the refined 2FoFc map (light blue mesh, contoured at 1σ), with superimposed structure showing the RbpABL residues K74, K76, and R79 interactions with the DNA phosphate backbone. (C) Stereo view of the refined 2FoFc map (light blue mesh, contoured at 1σ), with superimposed structure showing the RbpACD interface with the β’ZBD and β’zipper region. (D) Sequence logo (top) derived from an alignment of 890 RbpA orthologs. Below are shown the Mtb and Msm RbpA sequences and at the bottom, the RbpA structural elements (NTT, CD, BL, SID). The filled dots above the sequences denote RbpA residues that interact with the β’ZBD/β’zipper region (green dots) or σA (blue dots).