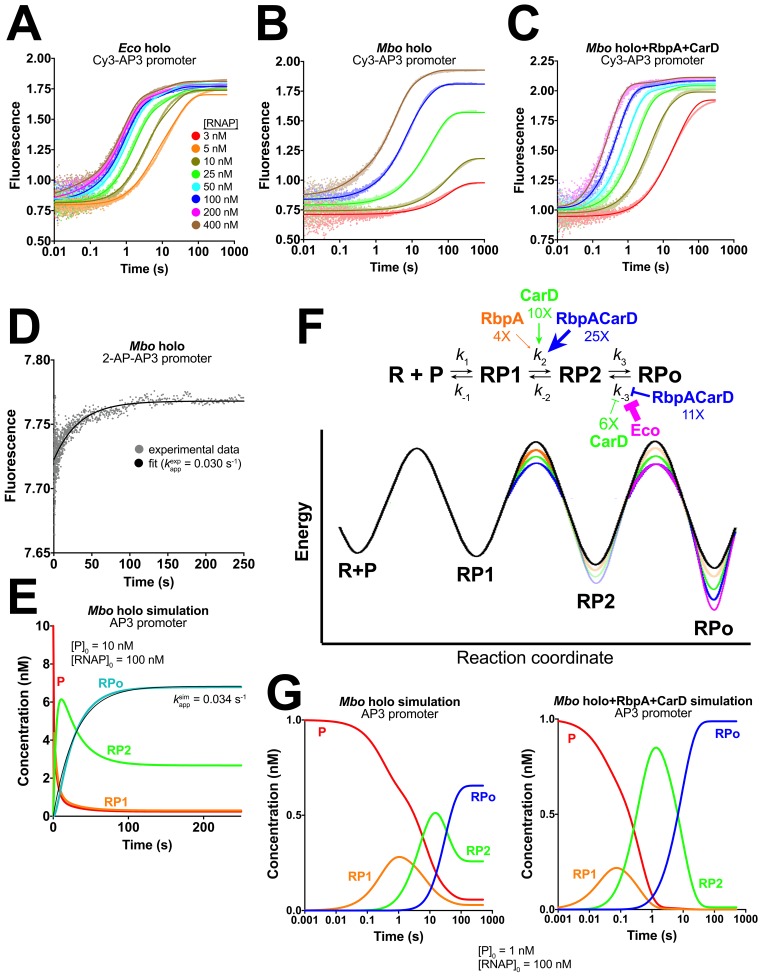
Figure 3. Kinetics of RPo formation on the AP3 promoter.
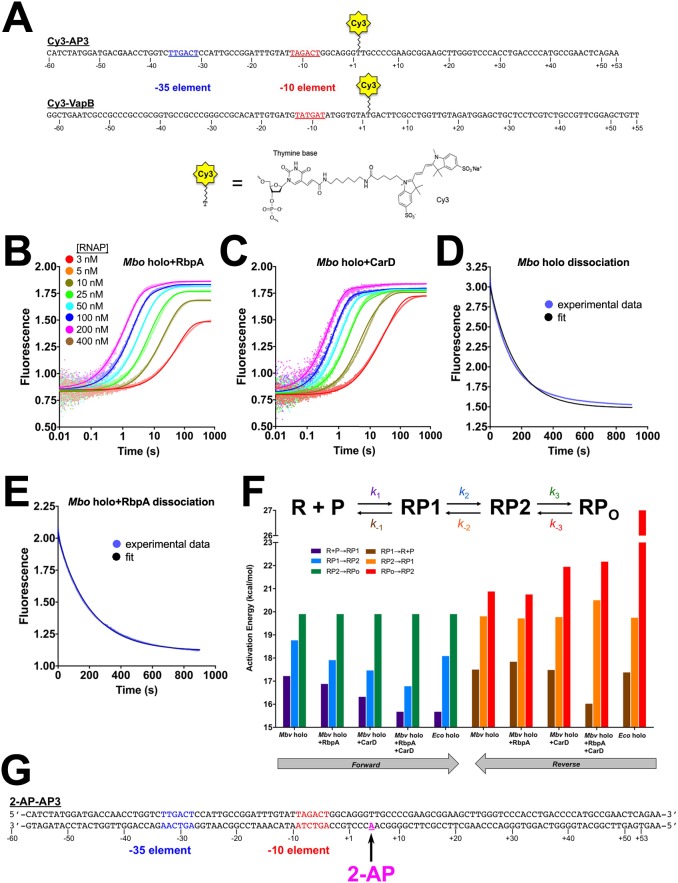
(A) Plot showing the fluorescence signal vs. time after rapid mixing of Eco holo with Cy3-AP3 promoter (Figure 3—figure supplement 1A) in a stopped flow fluorimeter. The [RNAP] giving rise to each curve is color-coded as shown in the legend. The experimental data are shown as points. The data were fit using the three-step sequential kinetic scheme (Equation 1), yielding the parameters listed in Supplementary file 4. The curve fits are shown as solid lines. (B) Same as (A) but with Mbo holo. (C) Same as (A) but with Mbo holo+RbpA+CarD. (D) Plot showing the fluorescence signal vs. time after mixing 100 nM Mbo holo with 10 nM 2-AP-AP3 promoter (Figure 3—figure supplement 1G) in a stopped flow fluorimeter. The experimental data are shown as points. The data were fit to a single-exponential (solid black line): yielding kappexp = 0.030 s−1. (E) Simulation of changes in the populations of P (red), RP1 (orange), RP2 (green), and RPo (blue) under the same conditions as the experiment of panel (D). The kinetic parameters used to generate the simulation are from Supplementary file 4. The data were fit to a single-exponential (thin black line), yielding kappsim = 0.034 s−1. (F) (top) The three-step sequential kinetic scheme that best accounts for all of the kinetic data is shown. The steps targeted by the transcription factors RbpA (orange), CarD (green), or RbpACarD together (blue) are denoted. Arrows pointing at a parameter indicate an increase in that parameter in the presence of the factor (compared to Mbo holo alone by the fold-amount shown below); the ‘T’ symbol indicates the factor reduces the parameter. The most important difference between the reference (Mbo holo alone) and Eco holo (magenta) is also illustrated. RbpA, CarD, and RbpACarD all increase k2 significantly. CarD also reduces k-3, as does Eco holo to a much greater extent. (bottom) Schematic free energy profile for RPo formation. The black curve represents Mbo holo alone. The colored curves illustrate the most important changes induced by the factors (RbpA, orange; CarD, green; RbpACarD, blue; Eco holo, magenta). (G) Simulations of changes in the populations of P (red), RP1 (orange), RP2 (green), and RPo (blue) when [P]0 = 1 nM and [RNAP]0 = 100 nM for Mbo holo alone (left) and Mbo holo+RbpA+CarD (right). The kinetic parameters used to generate the simulation are listed in Supplementary file 4. RbpA and CarD together induce a significant increase in k2, producing a large transient burst of RP2, driving formation of RPo.


