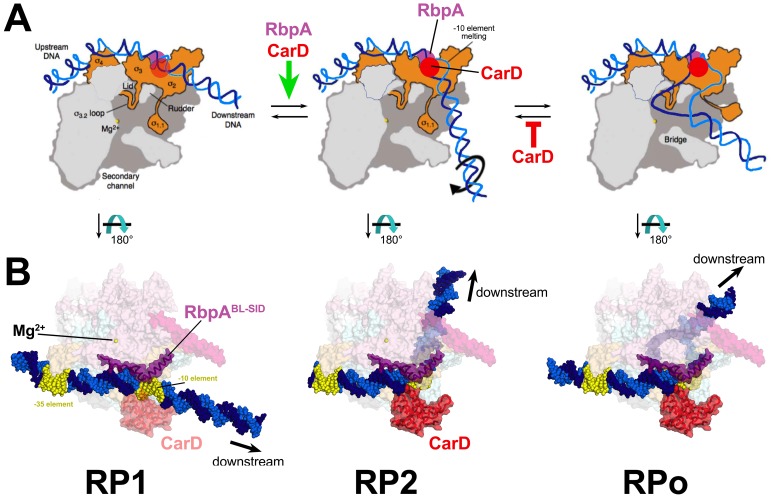
Figure 6. Structural transitions during the steps of RPo formation.
(A) Schematic, cross-sectional views of the RNAP holo (catalytic Mg2+, yellow sphere) and the promoter DNA (t-strand, dark blue; nt-strand, blue). RP1 and RP2 represent hypothetical models (Saecker et al., 2011). Crystal structures of RPo are available (Bae et al., 2015b; Zuo and Steitz, 2015). The important functional interaction of RbpA and CarD with the promoter DNA are schematically illustrated (RbpA, purple dot; CarD, red dot), based on the Msm RbpA/TIC structure (Figure 1). (B) Explicit structural models of the Msm RbpA/CarD/TIC with promoter DNA modeled as in the hypothetical models in (A). The RNAP is shown as a transparent molecular surface (color-coded as in Figure 1). RbpA and the modeled CarD (Figure 2D) are shown as transparent molecular surfaces with the backbone ribbon also shown. The −35 and −10 elements are colored yellow.

