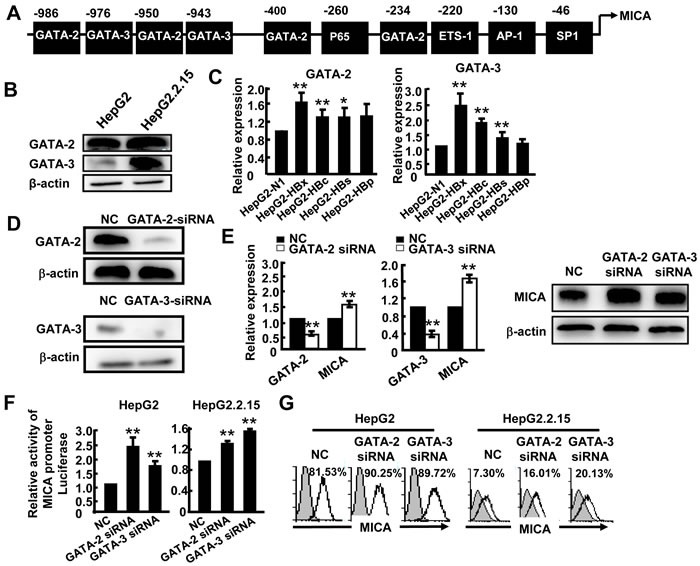
Figure 4. GATA-2 and GATA-3 suppress MICA expression.

A. Prediction of GATA-2 and GATA-3 binding sites in the MICA promoter. B. Western blot analysis of GATA-2 or GATA-3 expression in HepG2 and HepG2.2.15 cells. C. HepG2 cells were transfected with pEGFP-N1, pEGFP-HBx, pEGFP-HBc, pEGFP-HBs or pEGFP-HBp for 48 h, and then GATA-2 and GATA-3 mRNA levels were detected by qPCR. D. GATA-2-siRNA or GATA-3-siRNA was transfected into HepG2.2.15 cells for 48 h. The silence effect was detected by Western blot. E. GATA-2, GATA-3 and MICA expression was measured by qPCR (left) and Western blot (right). F. HepG2 cells or HepG2.2.15 cells were transfected with GATA-2-siRNA or GATA-3-siRNA together with a MICA promoter reporter plasmid for 36 h, and then relative luciferase activity was examined. Renilla luciferase activity was normalized to firefly luciferase activity. G. Flow cytometric analysis of MICA expression in HepG2 or HepG2.2.15 cells after transfection with GATA-2-siRNA or GATA-3-siRNA. **P < 0.01; *P < 0.05, compared with negative control (paired t-test).
