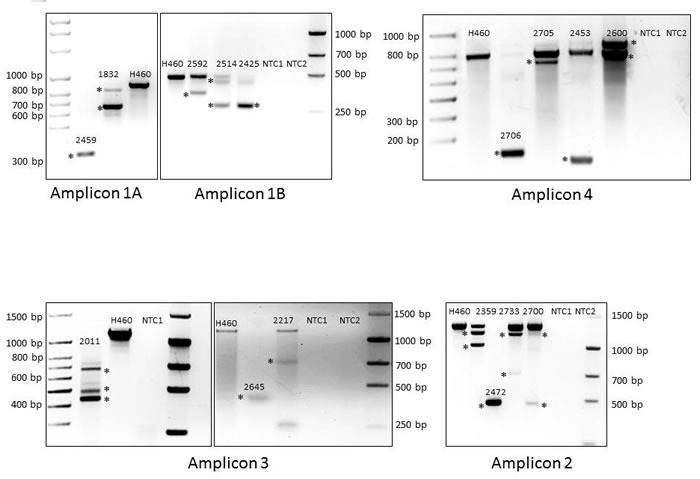
Figure 4. BRG1-Negative Primary Tumors Show Aberrant BRG1 Splicing.

Amplification of the 1A, 1B, 2, 3 and 4 amplicons are shown in a positive control cell line (H460: wild type band) along with those specific BRG1-deficient primary tumors that show altered splicing. The chromatographs for each aberrantly spliced BRG1 transcript are shown in Supplementary Figure 3.
