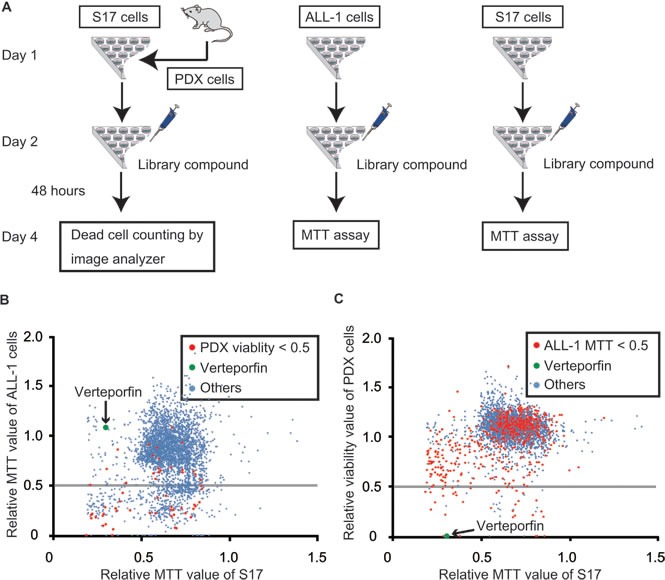
Figure 2. Comparison between PDX-cell screening and Cell-line screening.

A. Flow chart of screenings. PhLO were sacrificed to obtain PDX cells on day 1. PDX cells (1.0 × 10⁴ / well) and S17 cells (1.0 × 10³ / well), ALL-1 cells (1.0 × 10⁴ / well) alone, and S17 cells (1.0 × 10³ / well) alone were seeded on 96-well plates as indicated on day 1. Drug-library compounds were added on day 2. After 48 h, PDX cells were stained with Hoechst 33342 and PI. The viability of PDX cells was analyzed with an image analyzer. The growth of ALL-1 cells and S17 cells was measured by an MTT assay. B. Results of Cell-line screening. All compounds were plotted on a scattergram on which the relative MTT values of ALL-1 cells and S17 cells were set on the Y-axis and X-axis, respectively. The relative MTT values are relative values to the MTT value of the control cells treated with vehicle (DMSO). Effective compounds in PDX screening are plotted in red. Verteporfin is represented in green. The gray line indicates that the MTT value of ALL-1 is 0.5. Many of the red dots were plotted under the gray line, indicating that the effective compounds in PDX-cell screening were also frequently effective in Cell-line screening. C. Results of PDX-cell screening. All compounds were plotted on a scattergram on which the relative viabilities of PDX cells and relative MTT values of S17 cells were set on the Y-axis and X-axis, respectively. Effective compounds in Cell-line screening are plotted in red. Verteporfin is represented in green. The gray line indicates that the viability of PDX cells was 0.5. Few of the red dots were plotted under the gray line indicating that effective compounds in Cell-line screening were rarely effective in PDX-cell screening.
