
Figure 2. In vitro and in vivo expression of Gas6.
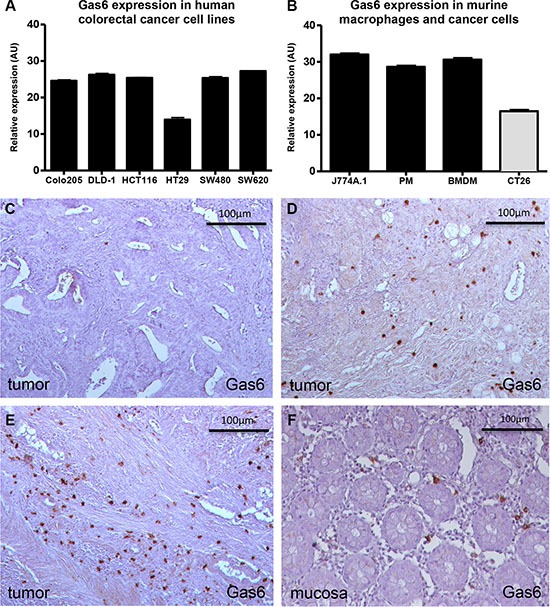
(A) RT-PCR analyses showing similar Gas6 expression in different human colorectal cancer cell lines (n = 3; AU = 50 – ΔCp). (B) RT-PCR analysis showing higher Gas6 expression in murine macrophages (PM = peritoneal macrophages; BMDM = Bone marrow derived macrophages) compared to the murine colorectal cancer cell line CT26 (n = 3; AU = 50 – ΔCp). (C–E) Exemplary immunohistochemistry stainings for Gas6 in human colorectal cancer samples showing variable Gas6 expression (brown) (low to high = C–E) in tumor infiltrating cells (20 × magnification). (F) Exemplary staining for Gas6 in human colorectal mucosa sample showing Gas6 expression (brown) in infiltrating cells (20 × magnification). Scale bar = 100 μm.