
Figure 3. In vivo and in vitro expression of Gas6 in human and murine macrophages.
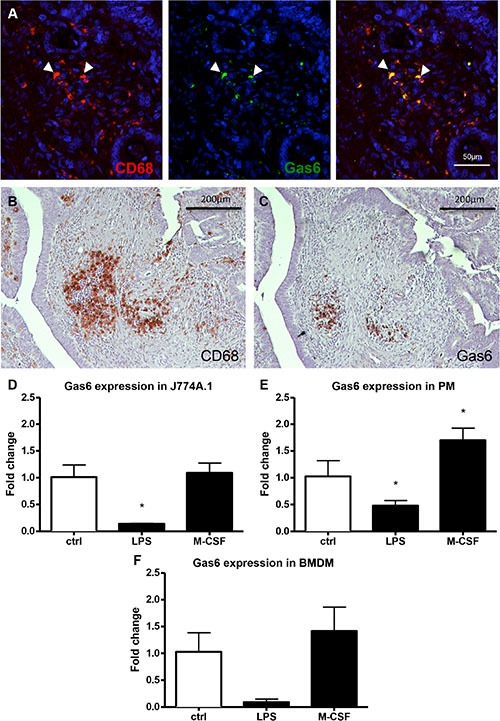
(A) CD68 (red) and Gas6 (green) double staining in human colorectal cancer tissue sample showing co-expression (orange) of the two antigens in tumor infiltrating macrophages (40 × magnification, scale bar = 50 μm). (B) Staining for CD68 as a macrophage marker in human colorectal cancer tissue sample showing infiltrating macrophages (brown; 10 × magnification, scale bar = 200 μm). (C) Sequential staining in the same tissue area for Gas6 in human colorectal cancer tissue sample showing Gas6 expression in tumor infiltrating cells. Gas6 co-localizes to CD68 macrophages in the previous section (brown; 10 × magnification, scale bar = 200 μm). (D–F) RT-PCR analysis showing a reduced Gas6 expression in murine macrophages differentiated to a M1 (LPS) phenotype and an increased Gas6 expression in a M2 (M-CSF) phenotype (n = 3, P < 0.01). (PM = peritoneal macrophages; BMDM = Bone marrow derived macrophages).